An Overview of Cost-Burdened Households in the U.S. and Virginia
August 21, 2024
The affordability of housing has become a pressing issue as a significant number of Americans are grappling with the relentless rise in housing costs. Both homeowners and renters find themselves in a financial squeeze due to the current economic conditions. When households spend more than 30% of their monthly gross income on housing, they are considered cost-burdened, and if this figure exceeds 50%, the household is deemed severely burdened. We’ll provide an analysis of the housing cost ratio in different geographies and investigate the impacts on your local market.
Typically, homeowners have more housing bills to cover each month than renters but statistically have a higher household income.
As a homeowner, you are responsible for:
- Mortgage
- Utility Costs
- Property Taxes
- Home Insurance
- HOA (if applicable)
- Other fees
As a renter, you are responsible for:
- Rent
- Utility Cost
These are the factors used to calculate the housing cost ratio.
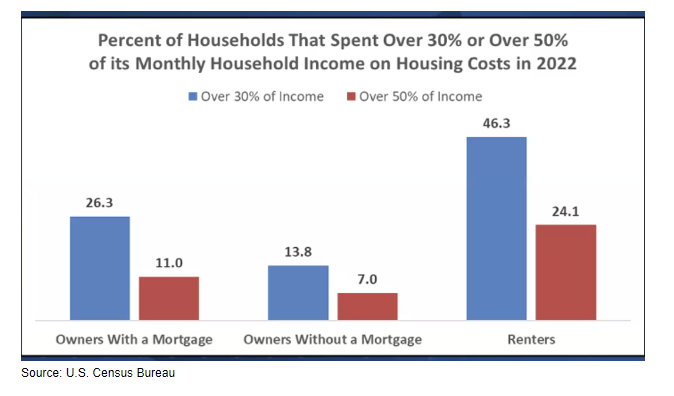
According to the most recent U.S. Census Bureau ACS (American Consumer Survey) data, 58 million U.S. households are cost burdened. Around 39 million U.S. households spend over 30% of their monthly income on housing expenses, and roughly 19 million households spend over 50%. The median housing cost ratios throughout the nation were 20.9% for homeowners with a mortgage, 11.3% for homeowners without a mortgage, and 31% for renters.
Renters
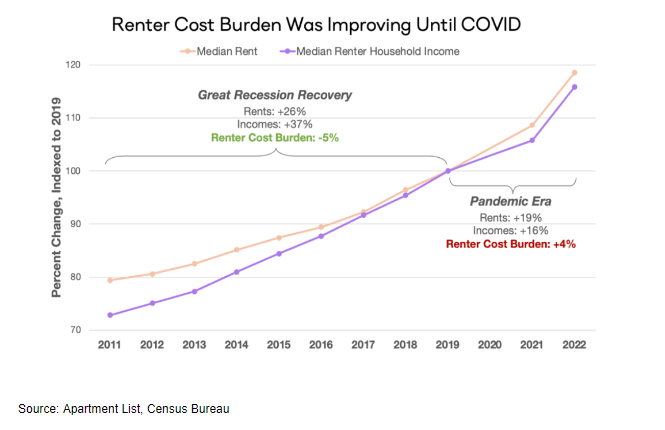
The pandemic caused damage to the progress made to help renters’ households not be cost burdened. Current data shows that the number of American renters that are cost burdened by housing has reached a new peak since 2012. Renters are more likely to be burdened from housing costs because of the lack of affordable rental homes and lower household incomes than homeowners.
Homeowners
Across the U.S., approximately 18 million owner-occupied households are struggling with the financial strain of homeownership, with 44% of this group considered severely cost burdened, according to recent data. In 2019, about 27% of homeowners (with a mortgage) were allocating a significant portion of their monthly income to their homes. Fast forward to 2022, and this figure has risen to roughly 28%, indicating a further financial burden on homeowners.
Owning a home is becoming more costly. According to a study from Bankrate, U.S. homeowners are paying an average of $18,118 a year on property taxes, homeowners’ insurance, maintenance, energy, and other housing costs. This is 26% higher than it cost to maintain a home four years ago, an additional $3,689. Even though the principal and interest on a mortgage tend to stay the same, these rising phantom costs can burden many owner-occupied households.
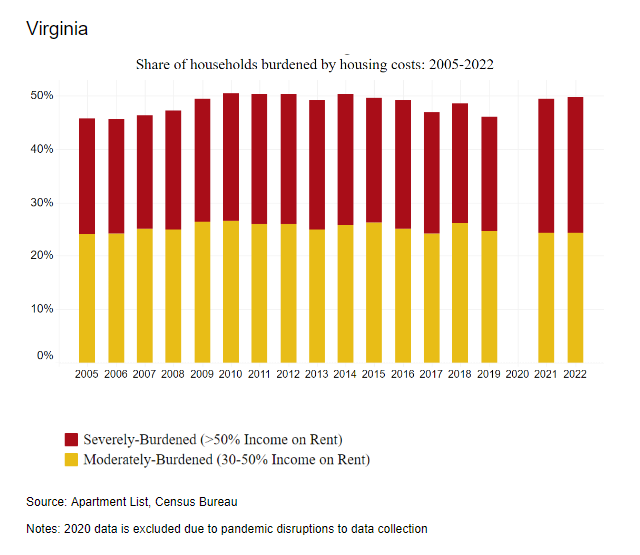
According to recent Census data, nearly 50% of renters and 20% of homeowners in Virginia were considered housing cost burdened. The metro areas with a large pool of renters who were severely cost burdened were Richmond, with a 53.7% cost burden rate, and Virginia Beach, with 55.7%. Hispanic and Black households in the state are struggling the most with high housing costs.
As stated before, the rising phantom costs of owning a home are burdening households. On average, owner-occupied households in Virginia spend $17,647 on hidden costs such as property taxes, homeowners’ insurance, maintenance, energy, and other housing costs, a $3,241 increase from 2020 (+23%).
Households should ideally have some financial breathing room once they’ve paid their monthly housing bills, but this can be a challenge in the current market. For potential home buyers, it is important to gain a comprehensive understanding of the hidden costs of homeownership to avoid being caught off guard by housing costs. This knowledge will empower them to make informed decisions and plan their finances effectively.
For more information on housing, demographic, and economic trends in Virginia, be sure to check out Virginia REALTORS® other Economic Insights blogs.
You might also like…
Whose House? A Look at Household Types in Virginia
By Dominique Fair - February 2, 2026
The traditional structure of an American household is alive and well but has shifted over the past 50 years to make way for more non-traditional ones. Virginia at… Read More
Key Takeaways: December 2025 Virginia Home Sales Report
By Virginia REALTORS® - January 26, 2026
Key Takeaways 2025 home sales activity ended on a strong note, in what had otherwise been a sluggish year in Virginia’s housing market. There were 8,482 homes sold… Read More
3 Predictions for Virginia’s Housing Market in 2026
By Sejal Naik - January 21, 2026
2025 was a year of improving inventory conditions, a downward trend in mortgage rates in the latter part of the year, increasing prices, and a modest growth in… Read More