Key Trends: Q1 – 2023 Multifamily Report
May 17, 2023

Rental demand in Virginia remains strong, though the intensity has eased over the past year or so. Vacancy rates are up and rent growth has slowed across property types and regions. The pipeline of new construction remains robust, though the pace of deliveries has waned. Inventory for multifamily homes grew in most metropolitan areas in Virginia during the first quarter, as demand continues to increase. The rise of vacancy rates has slowed down rent growth over the past year across regions and property types. At 6.1%, the statewide vacancy rate in Q1- 2023 was the highest it’s been in the last five years. Compared to a year ago, the average effective rent rose by 3.6% in the first quarter of this year. In the first quarter of 2023, approximately 800 multifamily units were absorbed in Virginia, down from 3,100 this time last year. In this blog, we’ll go over the key trends from the Virginia REALTORS® 2023 Q1 Multifamily Report in the various metro areas in Virginia.
Breakdown by Metropolitan Statistical Area (MSA)
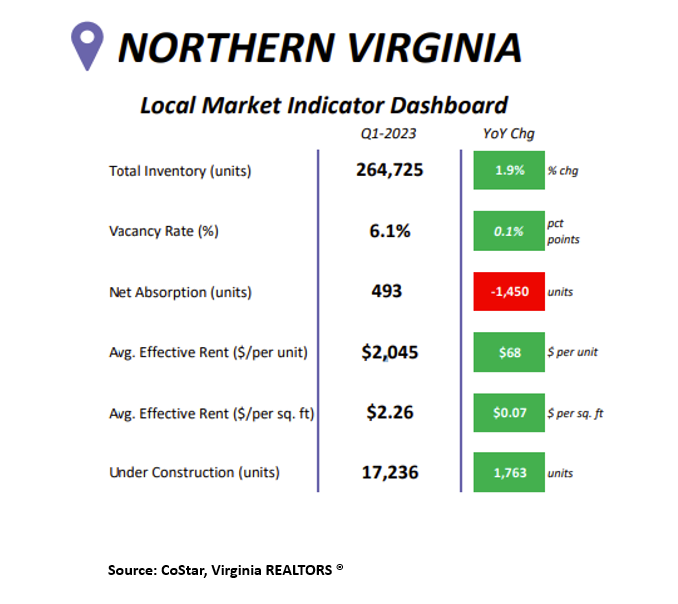
There were 17,236 units under construction in Northern Virginia in the first quarter, 1,763 more than last year. At $2,045, the average effective rent (per unit) in Northern Virginia increased by $68, a 3.4% increase from a year ago. In the first quarter of 2023, the net absorption rate fell by 1,450 units compared to last year. The vacancy rate in Northern Virginia was relatively high in the first quarter at 6.1%, a 0.1% increase from last year. There were 264,725 multifamily units in Northern Virginia in the first quarter, a 1.9% increase from a year ago.
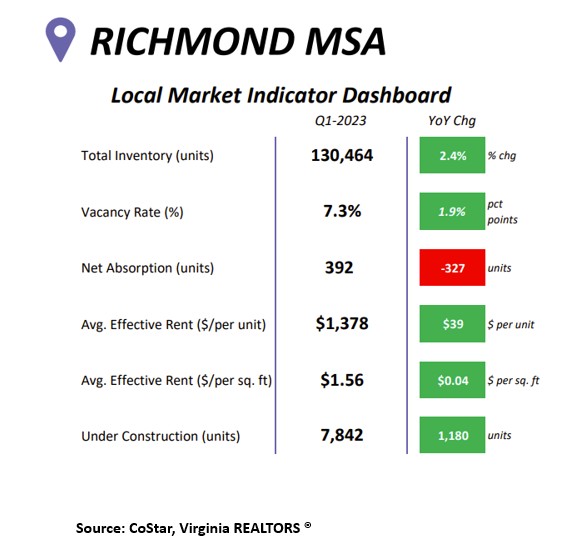
In Richmond, there were 130,464 multifamily units in the first quarter, a 2.4% increase compared to a year ago. At 7.3%, Richmond had the highest vacancy rate in the state during the first quarter, a 1.9% increase from a year ago. In the first quarter, there were 7,842 units under construction in the Richmond market, 1,180 more than a year ago. There were 392 units absorbed in the first quarter, which is 327 fewer than this time last year. Despite a strong vacancy rate in the local market, rent prices continue to climb. The average effective rent in the first quarter was $1,378, which is $39 more than last year.
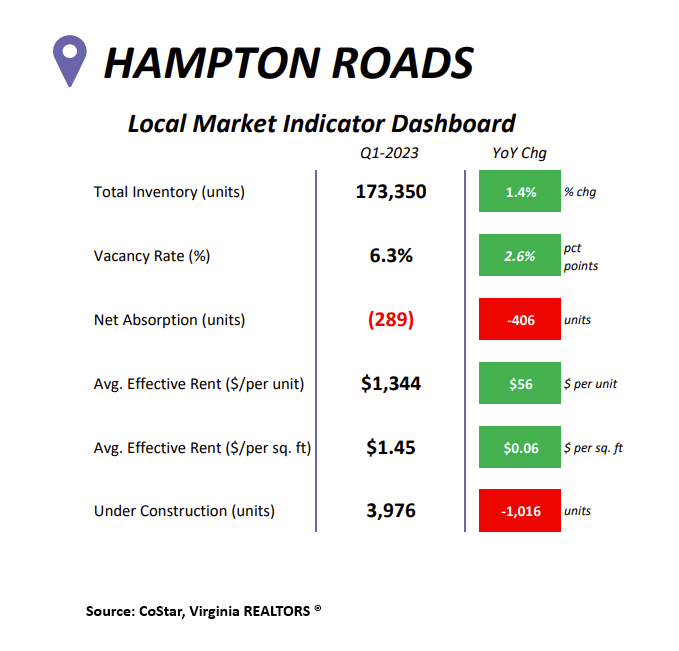
Multifamily inventory in Hampton Roads rose by 1.4% compared to last year, with 173,350 units in the first quarter. Net absorption has declined for four consecutive quarters in the Hampton Roads market. The total net absorption was -289 in the first quarter, 406 fewer than a year ago. The vacancy rate in Hampton Roads was 6.3% in Q1 – 2023, which is 2.6% higher than this time last year. This is the highest vacancy rate in Hampton MSA since 2019. The average effective rent in Hampton Roads in the first quarter was $1,344, a $56 increase from last year. At 3,976, the number of units under construction in Hampton MSA fell by over a thousand in the first quarter compared to last year.
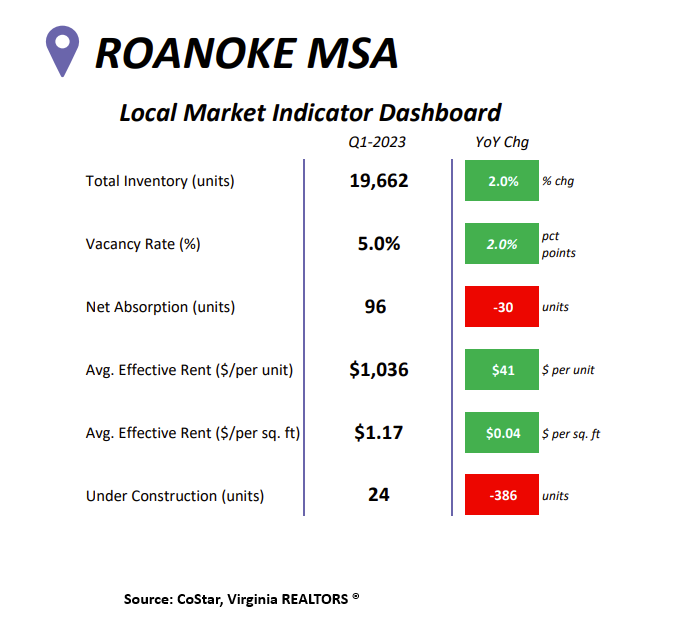
In Roanoke, 24 units were under construction in the first quarter, 386 fewer than a year ago. There were 19,662 multifamily units in the Roanoke MSA during the first quarter, a 2% increase from last year. At 96, net absorption in the first quarter fell by 30 compared to a year ago in the local market. The average effective rent in Roanoke was $1,036 in the first quarter, a $41 increase from last year. The vacancy rate in Roanoke was 5%, which is a 2% increase from last year.
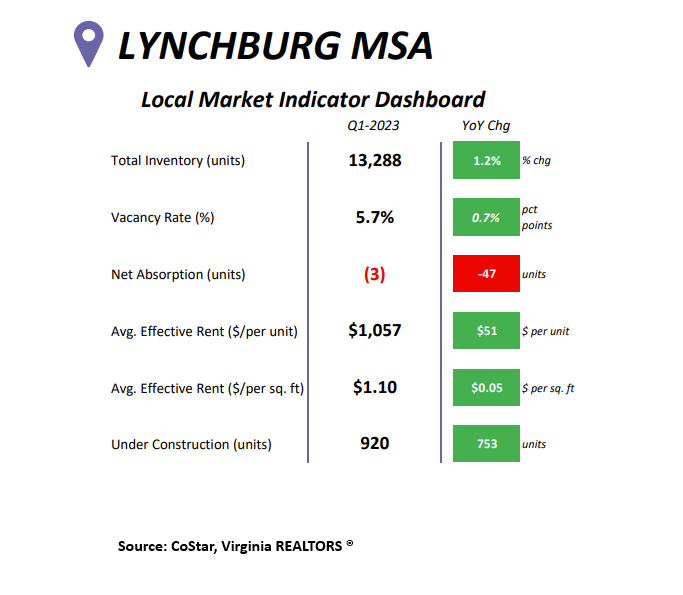
There were 13,288 multifamily units in the Lynchburg market during the first quarter, 1.2% more than this time last year. At 920, multifamily construction rose by 753 units in the first quarter compared to the previous year. The average effective rent price in Lynchburg was $1,057, a $51 price jump from a year ago. In the first quarter, the vacancy rate in Lynchburg was 5.7%, a slight rise of 0.7% compared to a year ago. Net absorption in Lynchburg was -3 in the first quarter, 47 fewer than last year.
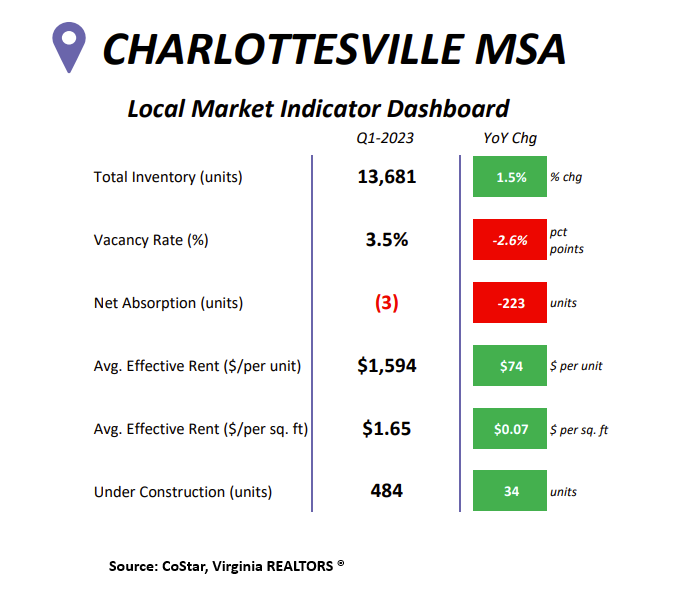
Throughout the state, rent costs rose the highest in Charlottesville compared to last year. In the first quarter, the average effective rent was $1,594 in Charlottesville, $74 higher than a year ago. There were 13,681 multifamily units in the area during the first quarter, a 1.5% growth from last year. The vacancy rate in the first quarter was 3.5% in Charlottesville, 2.6% lower than last year. Net absorption was -3 in the metropolitan area, 223 fewer units than last year. There were 484 units under construction in the Charlottesville MSA in the first quarter, 34 more than last year.
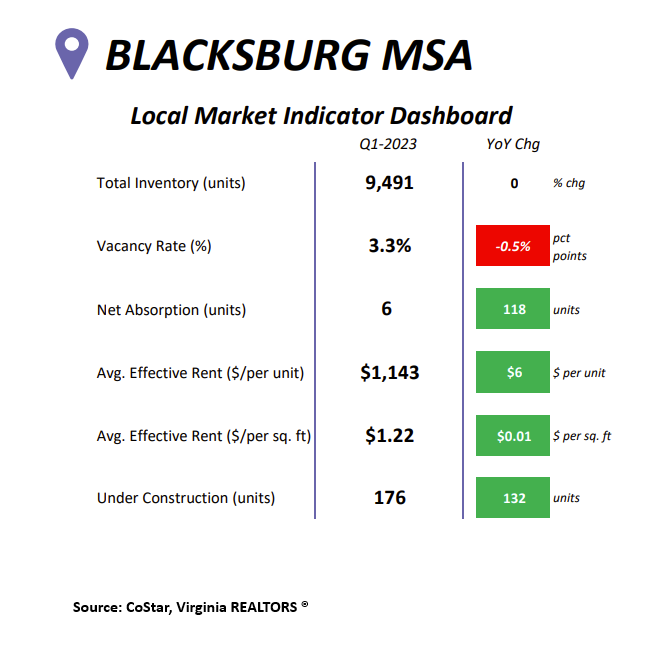
The vacancy rate in Blacksburg inched down by 0.5% in the first quarter from last year. The number of multifamily units remained unchanged in Blacksburg in the first quarter compared to a year ago at 9,491. At 6, the net absorption rose by 118 units in Q1 – 2023 compared to last year in the local metro area. Rent prices rose slightly in Blacksburg compared to a year ago (+ $6). There were 176 multifamily units under construction in the Blacksburg area, 132 more units than this time last year.
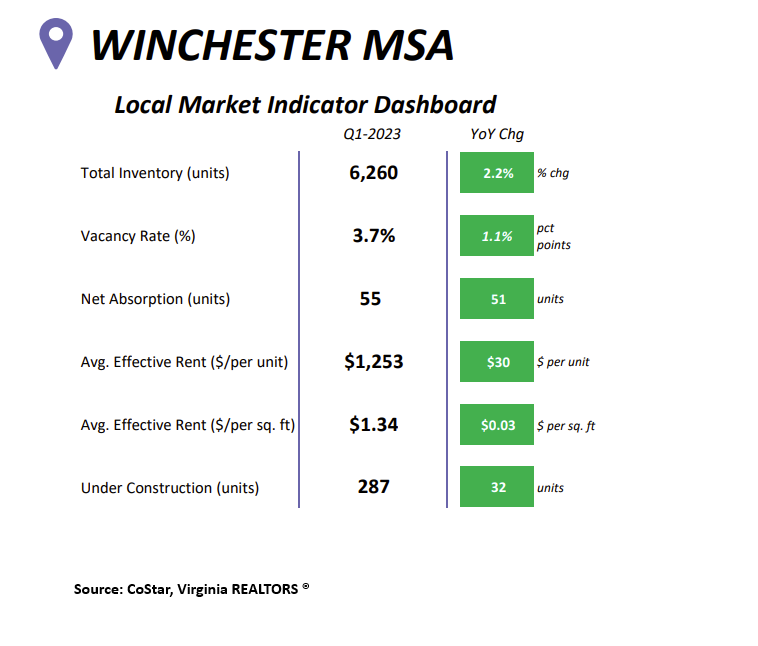
There were 287 units under construction in the Winchester MSA in the first quarter, 32 more than last year. Delivered-multifamily units rose in the Winchester area for the first time in a year. There were 6,260 multifamily units in the metro region in the first quarter, 2.2% higher than last year. Average effective rent rose by $30 per unit in the first quarter compared to the previous year. At 3.7%, the vacancy rate in Winchester rose by 1.1% in the first quarter compared to last year. In Winchester, net absorption increased by 51 units in the first quarter compared to the previous year.
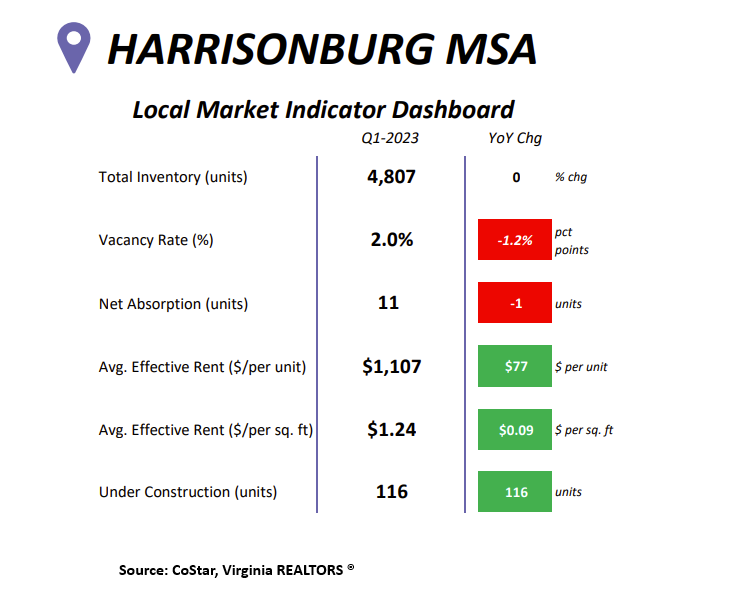
In the Harrisonburg metro area, there were 4,807 multifamily units, a 0% change from last year. The vacancy rate in the region was 2% in the first quarter, 1.2% lower than a year ago. Rent prices rose strongly in the metropolitan area during the first quarter. At $1,107, the average effective rent price increased by $77 in Q1 compared to last year. In the first quarter, there was one less absorbed unit in Harrisonburg than the previous year. There were 116 multifamily homes under construction in Harrisonburg during the first quarter, 116 more than last year.
We report on how the multifamily industry is trending in Virginia each quarter to help REALTORS® and property managers understand what is happening in their local markets. Be sure to check out our other quarterly reports on the Virginia REALTORS® Research & Statistics page.
You might also like…
Highlights from the 2026 JCHS State of the Nation’s Housing Report
By Dominique Fair - July 6, 2026
Every year the Joint Center for Housing Studies at Harvard University (JCHS) releases their State of the Nation’s Housing Report, showing where the housing market stands and how… Read More
Key Takeaways: May 2026 Virginia Home Sales Report
By Virginia REALTORS® - June 23, 2026
Key Takeaways Home sales activity increased in May, supporting the continued trend of rising home sales since the beginning of 2026. There were 10,940 closed sales across the… Read More
Celebrating National Homeownership Month: What Virginia’s Housing Data Tells Us
By Sejal Naik - June 17, 2026
June is National Homeownership Month—a timely reminder of the vital role that owning a home plays in building wealth, stabilizing communities, and strengthening the broader economy. For real… Read More