2020 Census Update: Population Up in Urban and Suburban Areas but Down in Rural Areas
September 16, 2021
Every ten years, the U.S. Census Bureau releases decennial census data, which is the most complete snapshot of everyone living in the United States. This new data can provide valuable insights into the overall demographic trends and patterns in Virginia, and how these changes could impact housing markets around the state. As more of the 2020 data set is released in phases by the Census Bureau, check back with us for more insights into the key demographic trends underway across Virginia. Here’s a look at some of the initial takeaways from the population counts at both the local and state level.
Virginia continues to grow, but at the slowest rate since the Great Depression
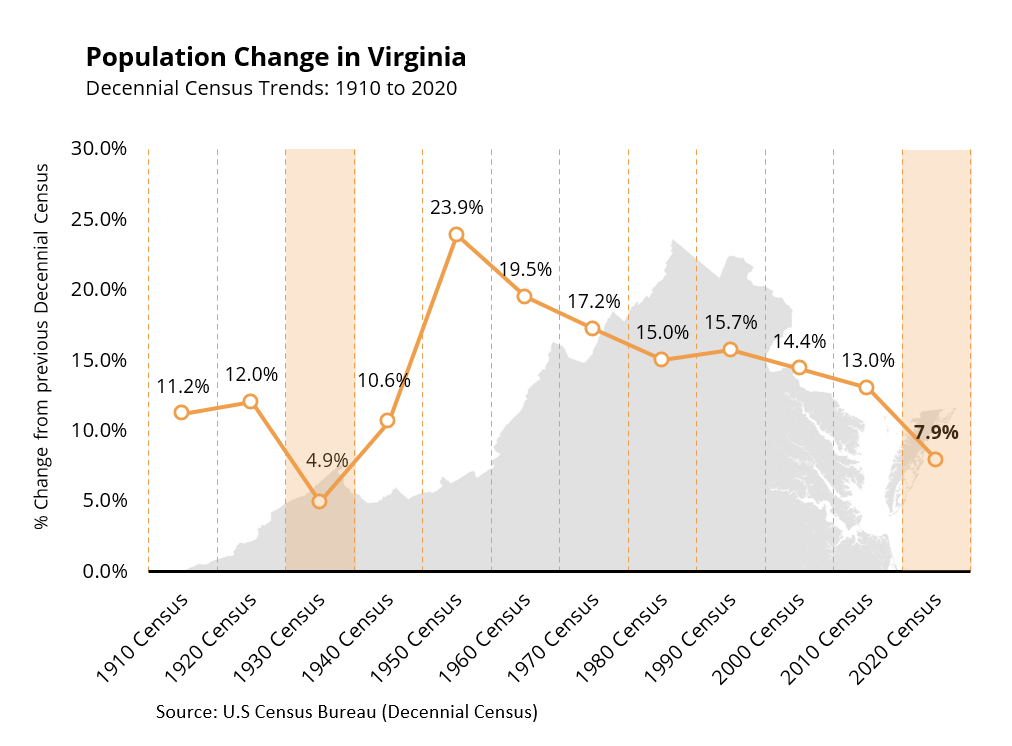
As of 2020, the Commonwealth of Virginia was home to more than 8.6 million people, making it the 12th most populous state in the country. Over the last decade, the state added more than 630,000 people, which represents a 7.9% growth rate. While population growth in Virginia continues to outpace the national rate (the U.S. population grew by 7.4% between 2010 and 2020), the rate of growth in Virginia has moderated to its lowest level since the Great Depression in the 1930s.
In more recent decades, the state’s growth patterns have been hovering in the 13% to 15% range, until now. The slower population growth this past decade is likely being driven by several factors, including an aging population (i.e., lower ratio of births to deaths) and also migration patterns (i.e, slower net migration into Virginia compared to the overall state population).
Which parts of Virginia are experiencing the most change?
The state had an influx of more than 630,000 residents overall during the last ten years; however, the location of this growth was generally concentrated in specific regions, while several regions are losing population.
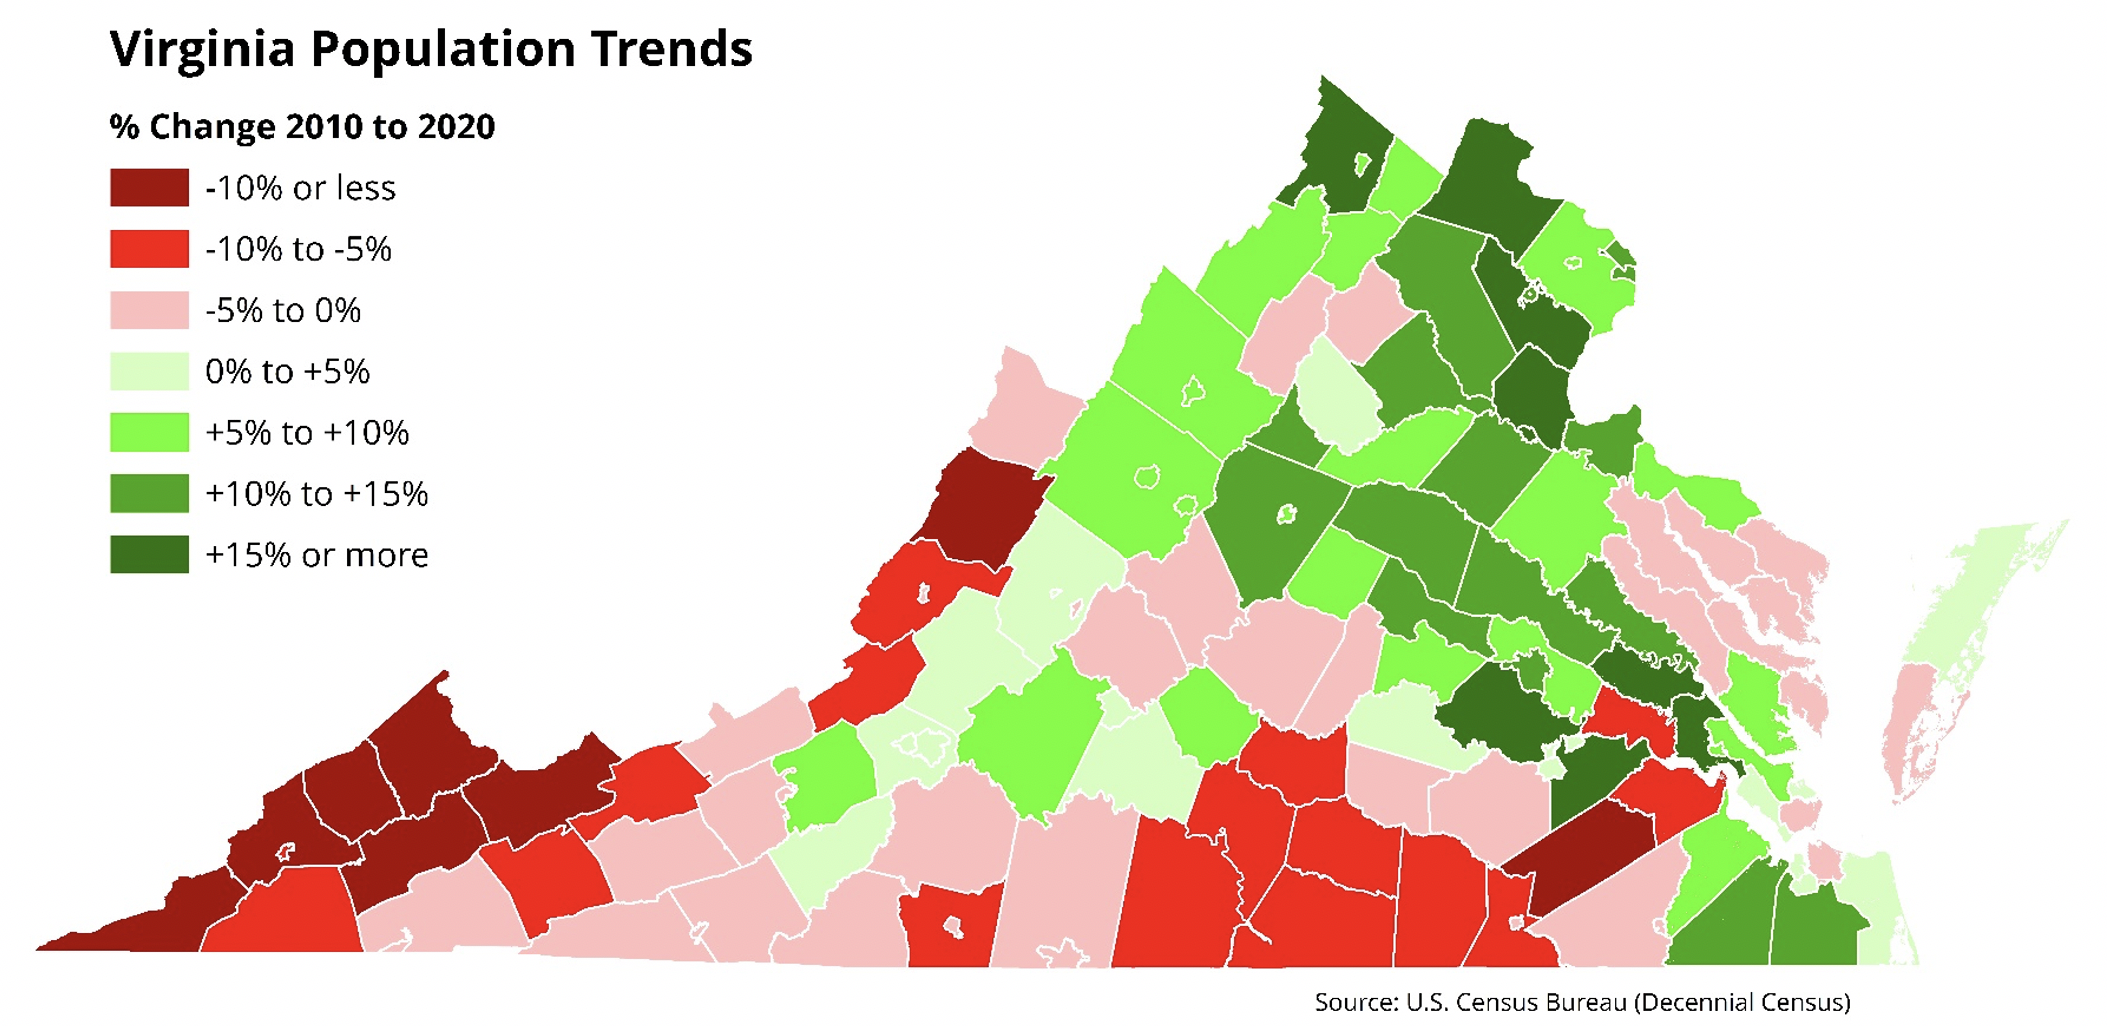
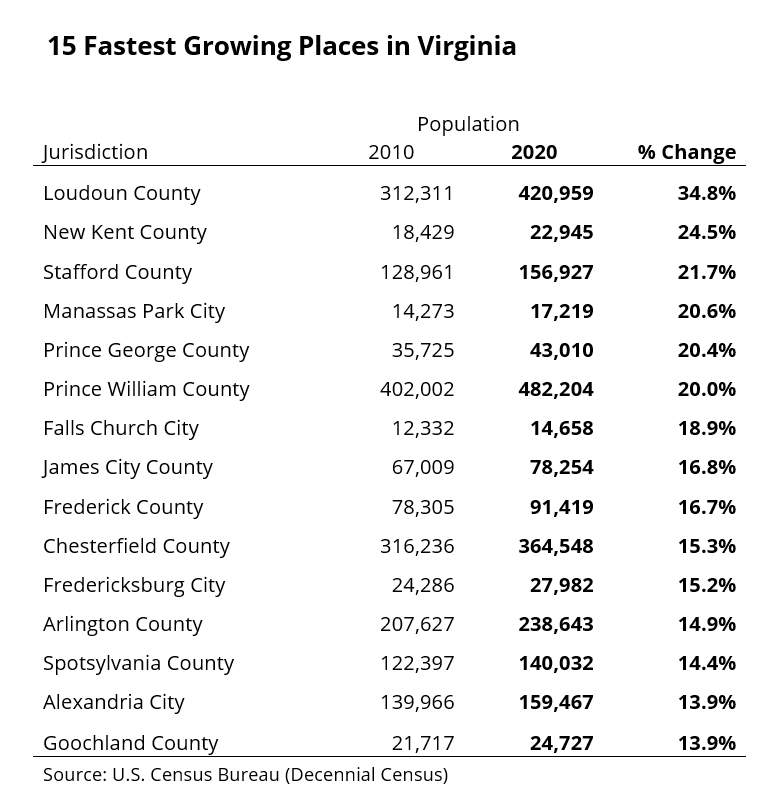
Most of the population gains in Virginia over the last ten years have occurred in the northern and eastern parts of the commonwealth, in an area commonly referred to as the state’s urban crescent. All of the 15 fastest growing localities are in this part of the state.
Loudoun County had by far the strongest population growth in the state, with an influx of more than 108,000 new residents between 2010 and 2020, which is a 34.8% surge. This is both the largest absolute increase and percentage growth in the state this decade.
Several other jurisdictions in Northern Virginia also experienced sharp population gains over the past decade, particularly in the suburban areas along the I-66 and I-95 corridors, including Stafford County (+21.7%), Prince William County (+20.0%), and Spotsylvania County (+14.4%).
Population growth was also strong around the Richmond Metropolitan Area. Chesterfield County had the largest absolute increase in the region, with more than 48,000 residents added between 2010 and 2020, which is a 15.3% increase. Other fast-growing communities in the Richmond Metropolitan Area include New Kent County (+24.5%), Prince George County (+20.4%), and Goochland County (+13.9%). All three of these areas are located along the edge of the Richmond region, which indicates rising market demand trends in the these largely suburban and rural communities.
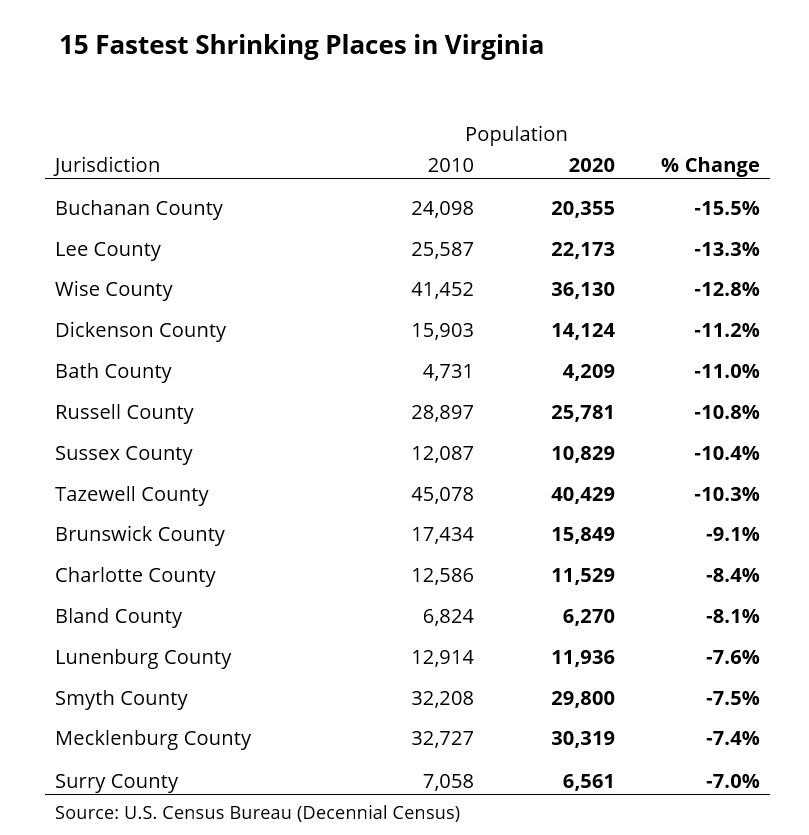
The far western and southern portions of Virginia experienced population declines between 2010 and 2020. The four counties shrinking the fastest are along the western-most part of the state, forming the border with Kentucky. Buchanan County had the largest rate of decline, with about 3,700 fewer residents in 2020 than there were in 2010, representing a 15.5% population drop. Wise County had the largest decline in absolute numbers, with about 5,300 fewer people living there than ten years ago, which is a 12.8% decrease. Some of the fastest shrinking areas in the southern part of Virginia include Sussex County (-10.4%), Brunswick County (-9.1%), and Charlotte County (-8.4%).
For more information on demographic and economic trends in Virginia, be sure to check out Virginia REALTORS® other economic insights blogs and our data page.
You might also like…
Key Takeaways: April 2026 Virginia Home Sales Report
By Virginia REALTORS® - May 21, 2026
Key Takeaways It was a relatively busy April in Virginia’s housing market. There were 9,758 closed sales statewide, a 4.5% increase from a year ago. The 2026 market… Read More
Understanding the Renter Lock-In Effect
By Dominique Fair - May 19, 2026
The lock-in effect has been a big topic over the last few years with rates hovering in the 6-7% range and home prices much higher than what they… Read More
Opportunity Zones in Virginia: What Every REALTOR® Should Know
By Sejal Naik - May 7, 2026
Established under the 2017 Tax Cuts and Jobs Act, Opportunity Zones (OZ) are a federal economic development and community development tax benefit designed to encourage long-term private investment… Read More