Midway Through 2024, Virginia Home Sales Activity Slightly Outpacing Last Year
July 24, 2024 - Robin Spensieri
Welcome Virginia REALTORS®
The Virginia REALTORS® Confidence Survey is sent out to Virginia REALTORS® members every month to collect their insights on local housing market conditions. This information provides a real-time look at housing market conditions. This month’s Confidence Survey was conducted from July 27th through July 31st and reflects housing market experiences in Virginia in July 2022. A total of 842 Virginia REALTORS® members responded to the survey, including 716 who had participated in a home sales transaction in the prior 30 days.
Current Market Conditions
Buyers
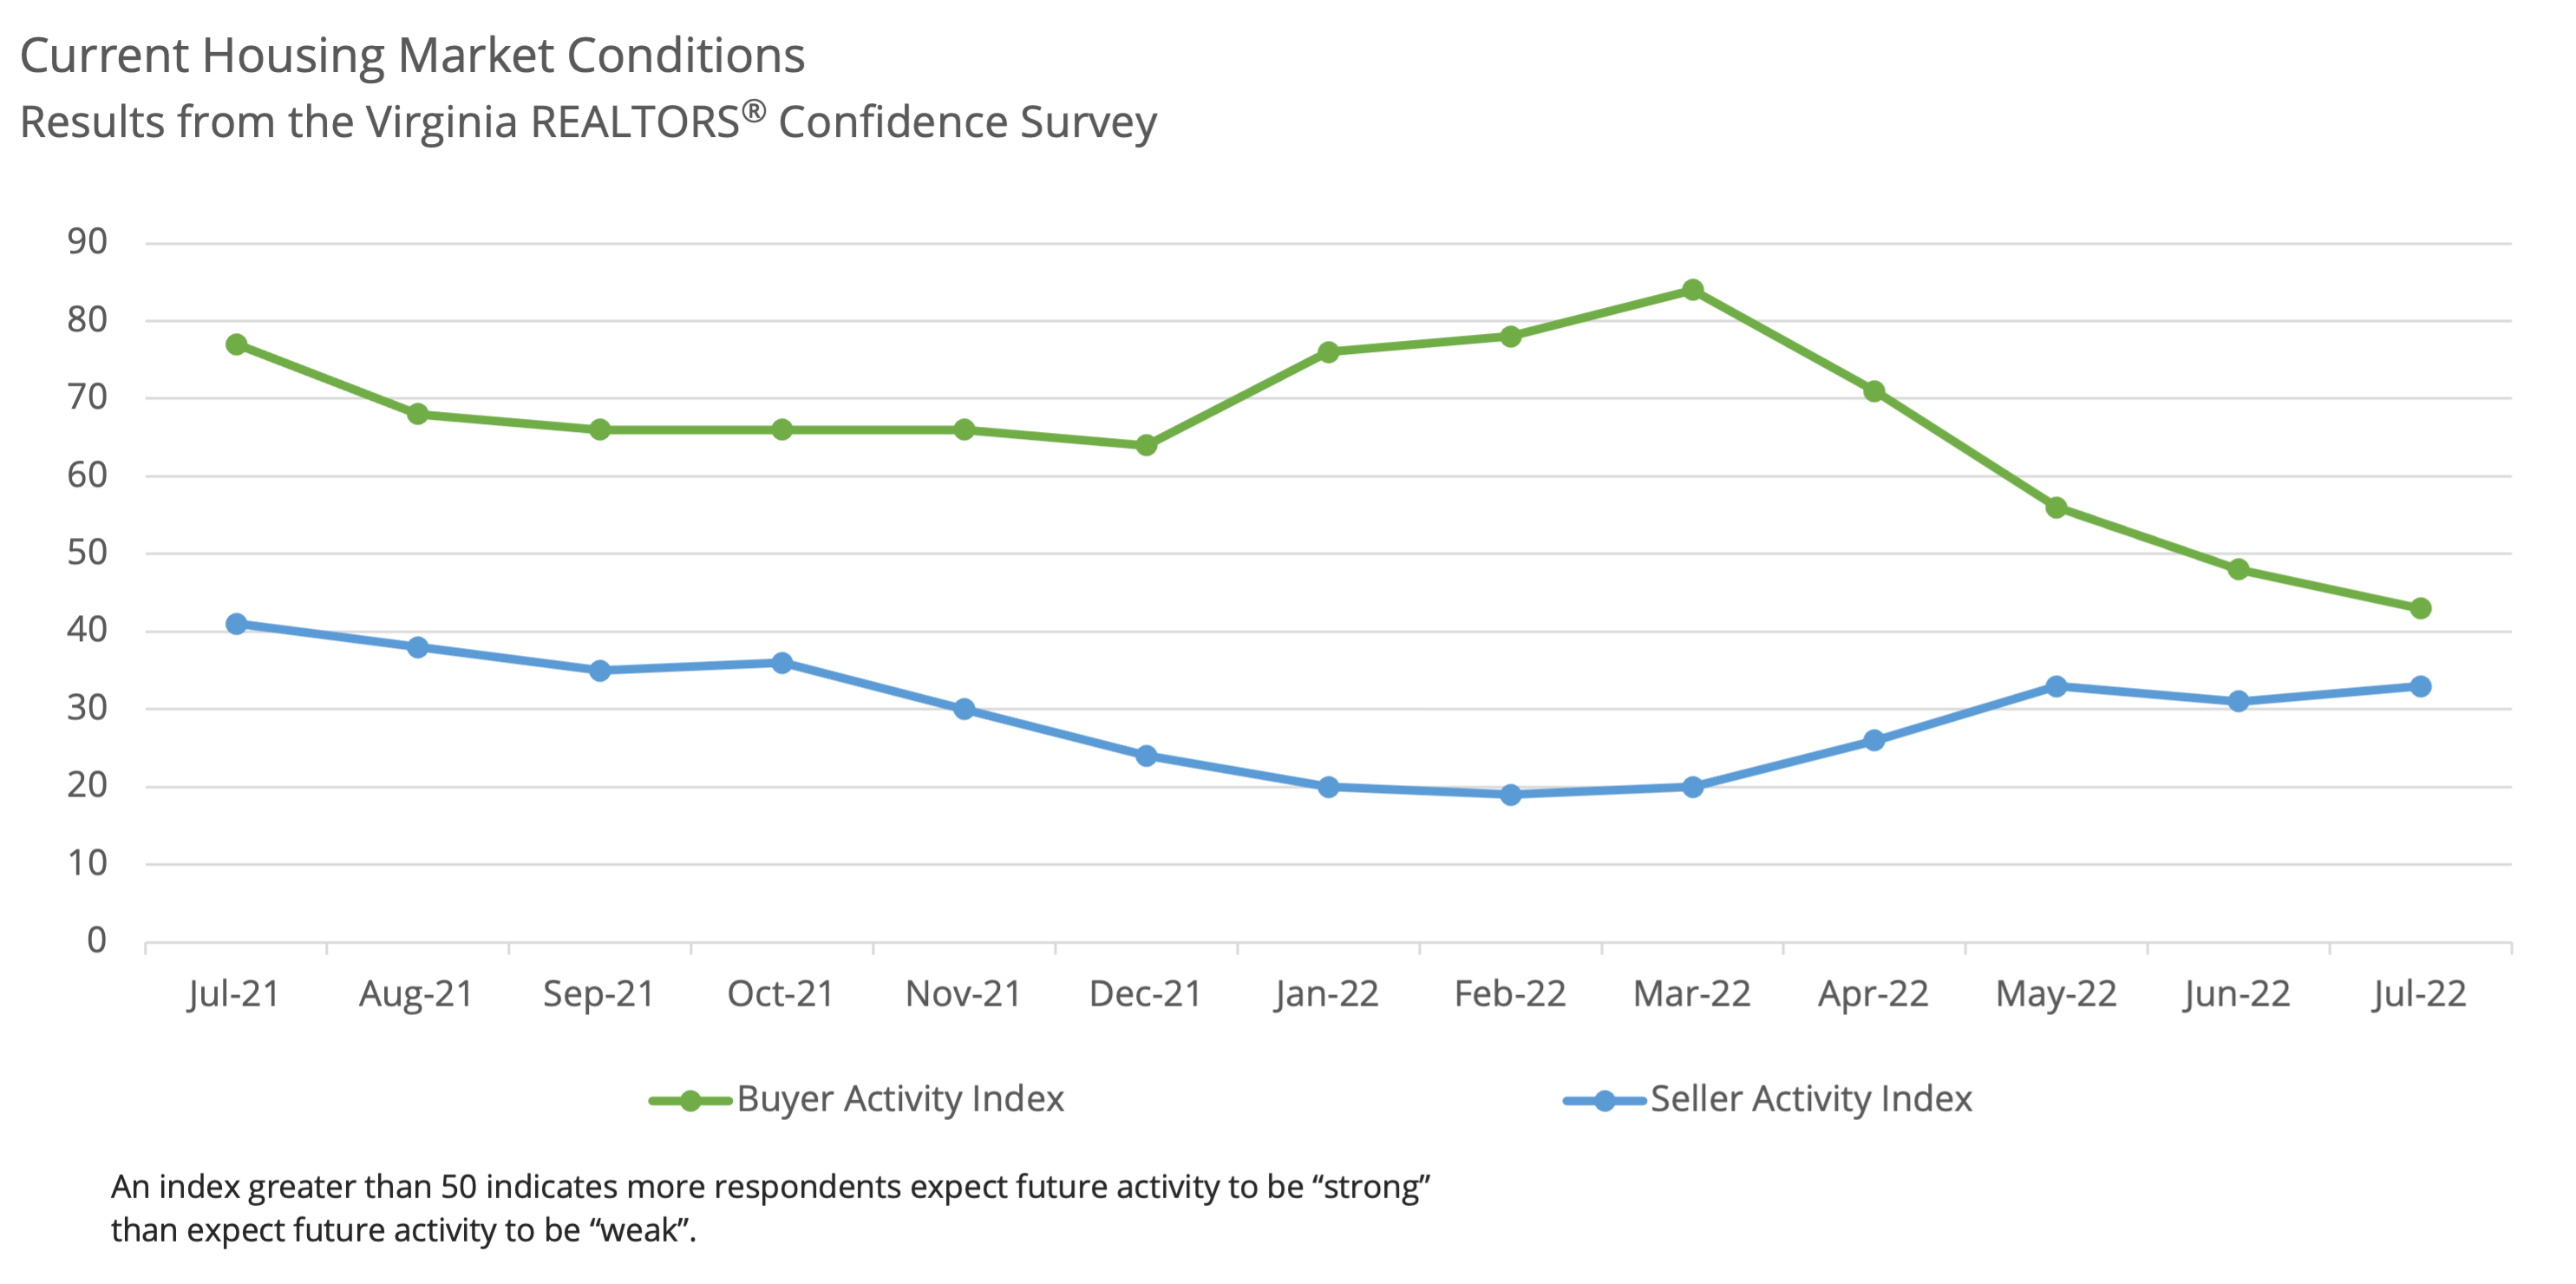
According to Virginia REALTORS®, buyer activity continued to drop in July. The Buyer Activity Index for July 2022 was 43, down from 48 in June and is the lowest level since we began tracking this information in July 2021. Just 19% of REALTORS® rated the level of buyer activity in their local market as “high” or “very high” in July, which is down from 26% in June.
About 29% of buyers in July were first-time buyers, according to respondents in this month’s survey, which is a change from June where 27% were first-time buyers. About 19% of purchases in July were all-cash purchases, going up three percentage points compared to last month. About 17% of sales in July were non-primary residence sales (e.g., rental property, second home, vacation home) increasing by two percentage points from June.
The number of sellers receiving multiple offers fell and the average number of offers decreased in July to the lowest number since the survey began according to REALTORS® responding to this month’s survey. Recent transactions received an average of 1.8 offers, down significantly from 3.1 offers on average in June. Roughly 48% of respondents stated that offers came in above list price in July, which is down from June.
Sellers
Seller activity had a slight uptick according to Virginia REALTORS®. In July, the Seller Activity Index was 33, up from 31 in June. About 9% of respondents reported that seller activity was “high to very high” in their local market in July. About 42% reported that seller activity was “low to very low,” which is down from last month when it was 49%.
Market Outlook
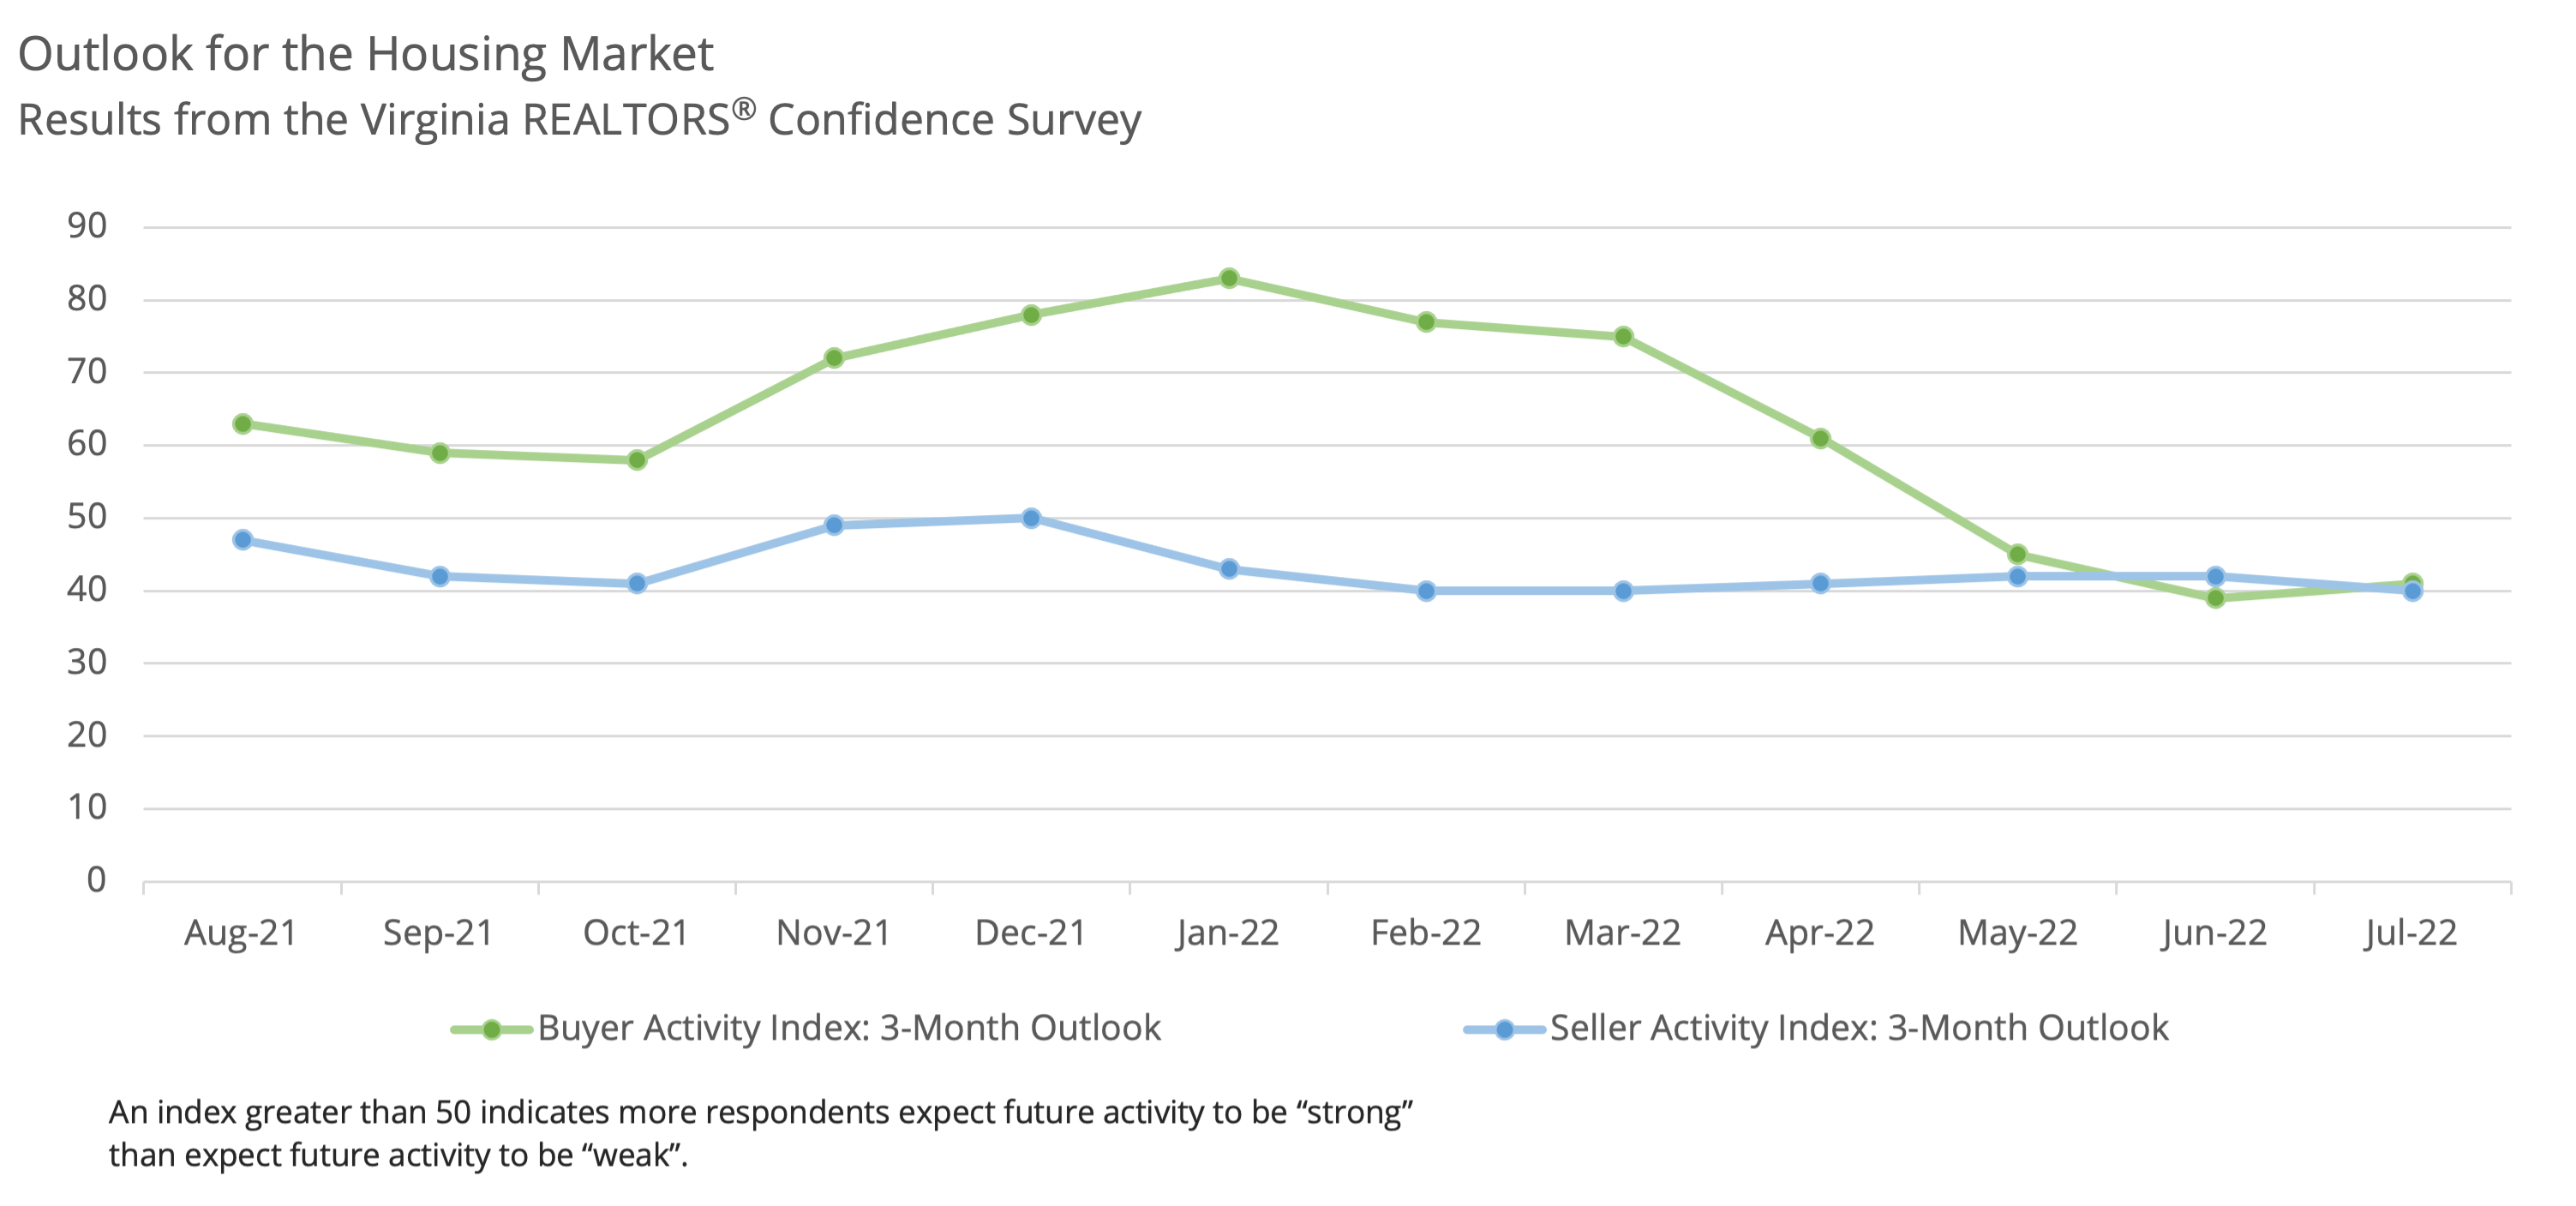
Confidence in home buying activity increased slightly but is still trending low. This index gauges how REALTORS® think the market will be performing in three months’ time. The index rose to 41 in July, up from 39 in June, which is still low compared to January’s high level of 83. Just 11% of respondents thought that buyer activity would be strong three months from now in their local markets. This is the second straight month that confidence in buyer activity fell.
The Seller Activity Index: 3-Month Outlook continued to moderate in July. The index was 40 this month, down from June when it was 42. Outlook for seller activity continued to drop. Only 9% of Virginia REALTORS® reported that they think seller activity will be strong in three months. This is down from 12% last month.
The share of survey respondents who expect prices to rise in their local markets in the next three months fell again this month to the lowest level since the survey began in July 2021. Just 18% of Virginia REALTORS® responding to the survey said that they expect prices to rise. Over half of REALTORS® (53%) responding to the survey thought prices would fall in three months. This the highest response to expected price dropping since the start of the survey. Another 26% of respondents expected prices to remain unchanged.
Virginia REALTORS® Confidence Survey: 2022 Highlights
| Key Indicators | Jan 2022 | Feb 2022 | Mar 2022 | Apr 2022 | May 2022 | June 2022 | July 2022 |
| Buyer Activity Indexa | 76 | 78 | 84 | 71 | 56 | 48 | 43 |
| Seller Activity Indexa | 20 | 19 | 20 | 26 | 33 | 31 | 33 |
| Buyer Activity Index: 3-Month Outlookb | 83 | 77 | 75 | 61 | 45 | 39 | 41 |
| Seller Activity Index: 3-Month Outlookb | 43 | 40 | 40 | 41 | 42 | 42 | 40 |
| Current Market Conditions | |||||||
| First-time Homebuyers, as a Percent of All Sales | 29 | 32 | 33 | 30 | 30 | 27 | 29 |
| Cash Sales, as a Percent of All Sales | 18 | 18 | 18 | 21 | 16 | 16 | 19 |
| Sales as Non-Primary Residence, as a Percent of All Sales | 21 | 14 | 16 | 19 | 15 | 15 | 17 |
| Average Number of Offers, Most Recent Transaction | 4.1 | 6.3 | 6.6 | 5.3 | 2.9 | 3.1 | 1.8 |
| Market Outlook | |||||||
| Percent of Respondents Who Expect Strong Buyer Activity in 3 Months | 70 | 63 | 59 | 36 | 18 | 13 | 11 |
| Percent of Respondents Who Expect Strong Seller Activity in 3 Months | 19 | 20 | 18 | 16 | 14 | 12 | 9 |
| Percent of Respondents Who Expect Prices to Rise in 3 Months | 64 | 69 | 68 | 43 | 32 | 19 | 18 |
| Percent of Respondents Who Expect Prices to Fall in 3 Months | 7 | 8 | 10 | 25 | 33 | 49 | 53 |
| Percent of Respondents Who Expect Prices to Remain Unchanged in 3 Months | 26 | 21 | 18 | 28 | 32 | 30 | 26 |
A An index greater than 50 indicates more respondents reported the level of activity as “high to very high” than reported the level of activity as “low to very low.”
B An index greater than 50 indicates more respondents expect future activity to be “strong” than expect future activity to be “weak”.
A note about surveys: This is not a randomized sample survey of Virginia REALTORS® members. However, the number of responses and the geographic coverage of respondents make it possible to draw conclusions about the opinions and expectations of Virginia REALTORS®. These statistics from this survey have a margin of error of +/- 3.3%.
Responses to our surveys are confidential. We do not look at individual responses but rather report data in the aggregate.
For more information about Virginia’s housing market, check out our most recent home sales report, local housing market data, or Facebook Live.
July 24, 2024 - Robin Spensieri
July 16, 2024 - Sejal Naik
July 15, 2024 - Dominique Fair