Key Takeaways: November 2024 Virginia Home Sales Report
December 19, 2024 - Virginia REALTORS®
Welcome Virginia REALTORS®
By Abel Opoku-Adjei
Research Associate, Virginia REALTORS®
Each month, the Virginia REALTORS® Confidence Survey gathers insights from REALTORS® on local housing markets based on their experiences with real estate transactions in the prior month. This information provides a real-time look at housing market conditions. This month’s Confidence Survey was conducted between October 24th and November 1st, 2022, and reflects housing market conditions in Virginia in October 2022. A total of 799 Virginia REALTORS® members responded to the survey, including 604 who had participated in a home sales transaction in the prior 31 days.
Current Market Conditions
Buyers
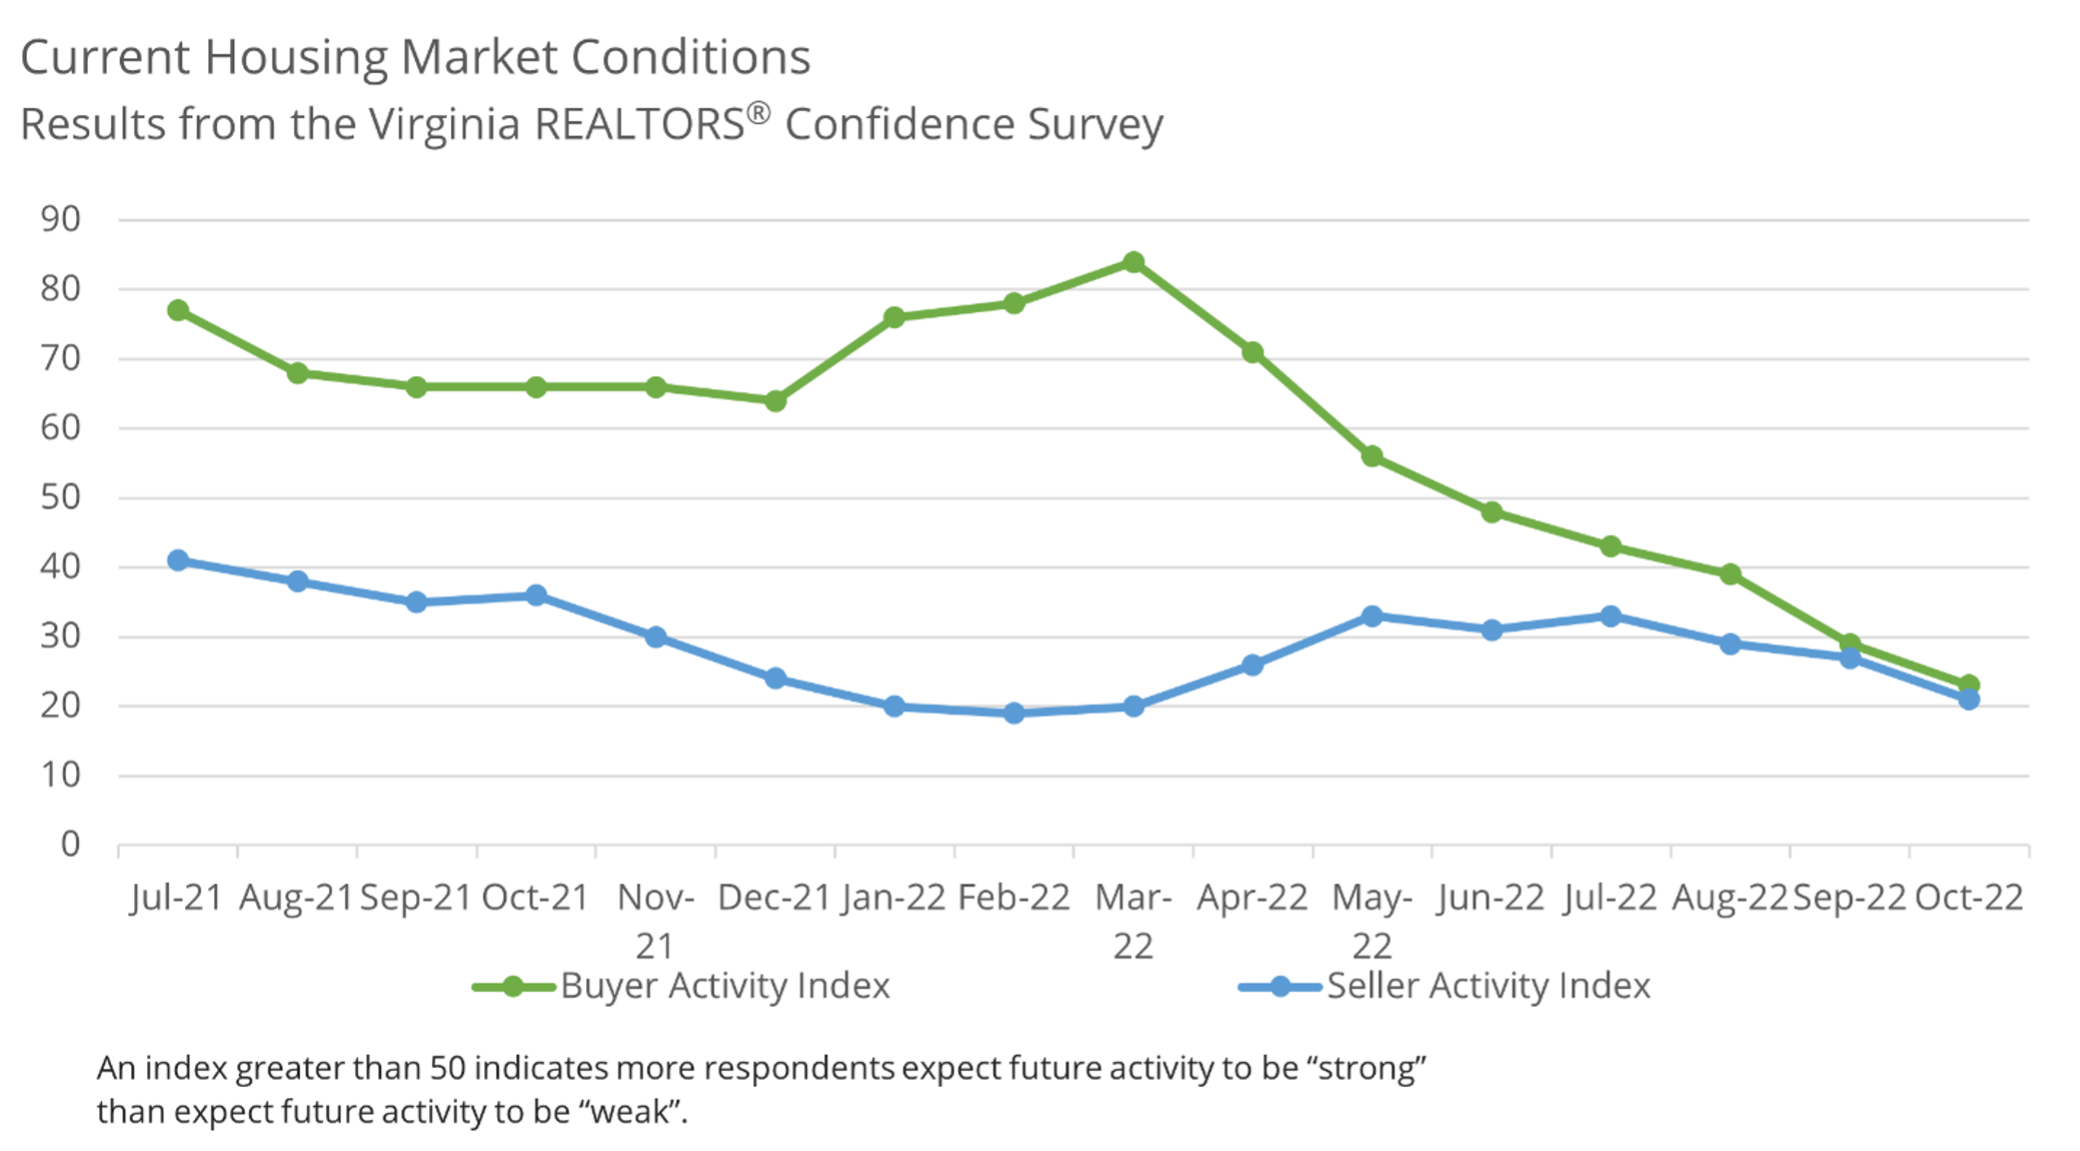
According to Virginia REALTORS®, buyer activity declined in October. The Buyer Activity index for the month was 23, which is down from 29 in September, the lowest level since the REALTOR® Confidence Survey launched in July 2021. About 6% of REALTORS® rated the level of buyer activity in their local markets as “high” or “very high”, and about 60% of REALTORS® rated buyer activity in their local market as “low” or “very low”.
Around 24% of buyers in October were first-time buyers, according to survey respondents, which is the lowest so far this year. In October, about 21% of respondents accepted an all-cash purchase, up from 19% in September. This month, there were about 20% non-primary residence sales (e.g., rental property, second home, vacation home), an increase of 2% from the previous month.
The average number of offers increased as sellers received more offers compared to September, according to REALTORS® responding to this month’s survey. Recent transactions received an average of 1.8 offers in October, a slight increase from 1.7 offers on average in September, but down from 2.4 offers on average from October 2021. During the month of October, about 29% of respondents stated that offers came in above the listing price, down from 32% in September.
Sellers
Seller activity declined in October, according to Virginia REALTORS®. In October, the Seller Activity Index was 21, a fall from 27 in September. About 3% of respondents reported that seller activity was “high to very high” in their local market, down 2% compared to last month. About 60% of REALTORS® reported that seller activity was “low to very low,” an increase from last month when it was 52%.
Market Outlook
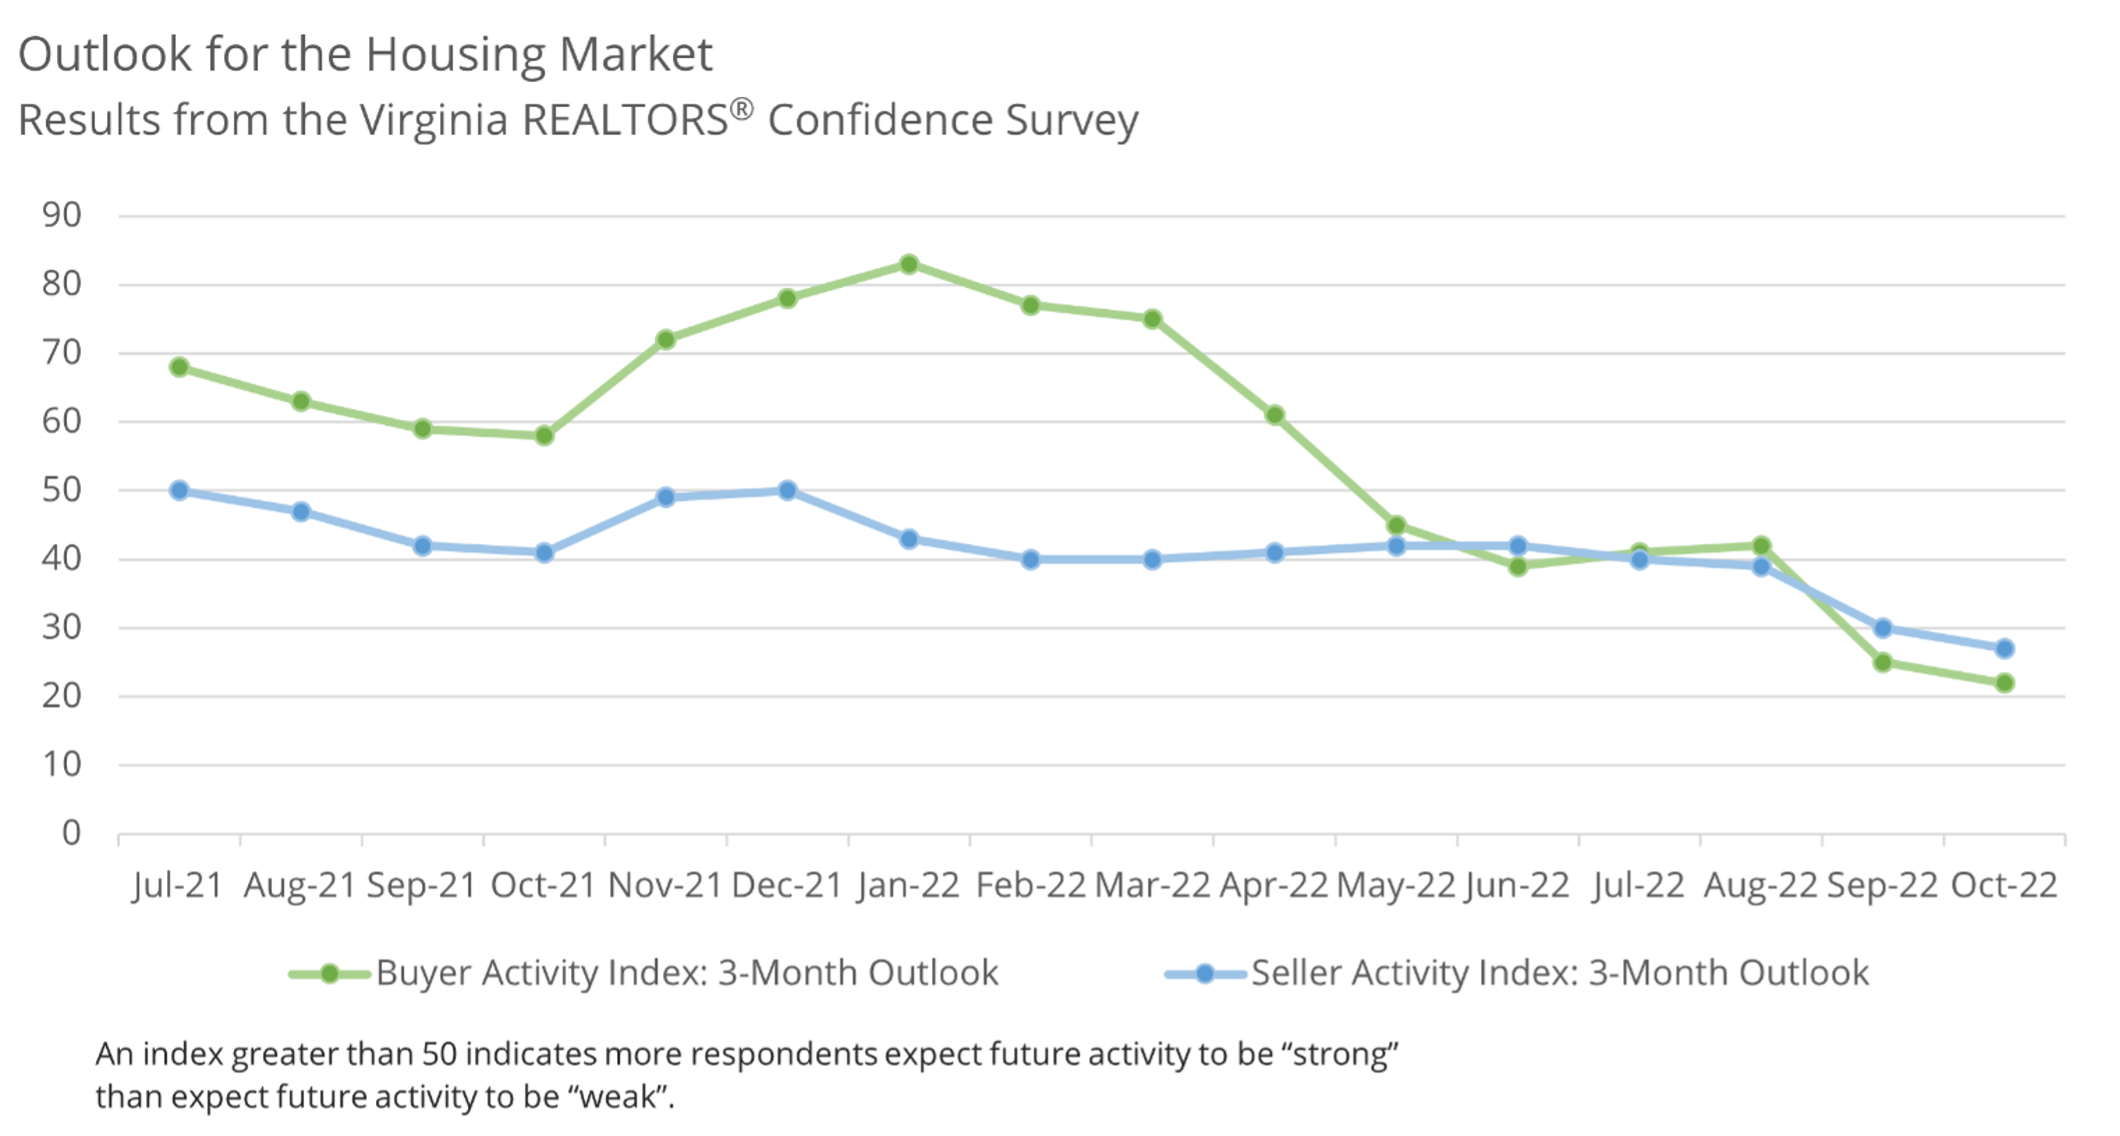
Confidence in future home buyer activity declined compared to last month. This index gauges how REALTORS® think the market will be performing in three months’ time. The index decreased to 22, down from 25 in September, the lowest since the REALTOR® Confidence Survey kicked off in July 2021. Remaining unchanged from last month, about 6% of respondents indicated that they thought buyer activity would be strong in the next three months in their local markets.
The Seller Activity Index: 3-Month Outlook declined in October. The index dropped slightly this month to 26. Only 3% of Virginia REALTORS® reported that they think seller activity will be strong in three months, down from 6% in September.
The share of survey respondents who expect prices to rise in their local markets in the next three months dropped again compared to last month. About 72% of Virginia REALTORS® responding to the survey stated that they believed prices will drop within the next few months. Roughly 20% of REALTORS® responding to the survey indicated that prices would remain the same for the next three months.
Virginia REALTORS® Confidence Survey: 2022 Highlights
| Key Indicators |
Jan 2022 |
Feb 2022 |
Mar 2022 |
Apr 2022 |
May 2022 |
June 2022 |
July 2022 |
Aug 2022 |
Sep 2022 | Oct 2022 |
| Buyer Activity Indexa | 76 | 78 | 84 | 71 | 56 | 48 | 43 | 39 | 29 | 23 |
| Seller Activity Indexa | 20 | 19 | 20 | 26 | 33 | 31 | 33 | 29 | 27 | 21 |
| Buyer Activity Index: 3-Month Outlookb | 83 | 77 | 75 | 61 | 45 | 39 | 41 | 42 | 25 | 22 |
| Seller Activity Index: 3-Month Outlookb | 43 | 40 | 40 | 41 | 42 | 42 | 40 | 39 | 30 | 26 |
| Current Market Conditions | ||||||||||
| First-time Homebuyers, as a Percent of All Sales | 29 | 32 | 33 | 30 | 30 | 27 | 29 | 28 | 32 | 24 |
| Cash Sales, as a Percent of All Sales | 18 | 18 | 18 | 21 | 16 | 16 | 19 | 22 | 19 | 21 |
| Sales as Non-Primary Residence, as a Percent of All Sales | 21 | 14 | 16 | 19 | 15 | 15 | 17 | 18 | 18 | 20 |
| Average Number of Offers, Most Recent Transaction | 4.1 | 6.3 | 6.6 | 5.3 | 2.9 | 3.1 | 1.8 | 1.7 | 1.7 | 1.8 |
| Market Outlook | ||||||||||
| Percent of Respondents Who Expect Strong Buyer Activity in 3 Months | 70 | 63 | 59 | 36 | 18 | 13 | 11 | 12 | 6 | 6 |
| Percent of Respondents Who Expect Strong Seller Activity in 3 Months | 19 | 20 | 18 | 16 | 14 | 12 | 9 | 9 | 6 | 3 |
| Percent of Respondents Who Expect Prices to Rise in 3 Months | 64 | 69 | 68 | 43 | 32 | 19 | 18 | 14 | 9 | 7 |
| Percent of Respondents Who Expect Prices to Fall in 3 Months | 7 | 8 | 10 | 25 | 33 | 49 | 53 | 51 | 66 | 72 |
| Percent of Respondents Who Expect Prices to Remain Unchanged in 3 Months | 26 | 21 | 18 | 28 | 32 | 30 | 26 | 30 | 23 | 20 |
A An index greater than 50 indicates more respondents reported the level of activity as “high to very high” than reported the level of activity as “low to very low.”
B An index greater than 50 indicates more respondents expect future activity to be “strong” than expect future activity to be “weak”.
A note about surveys: This is not a randomized sample survey of Virginia REALTORS® members. However, the number of responses and the geographic coverage of respondents make it possible to draw conclusions about the opinions and expectations of Virginia REALTORS®. These statistics from this survey have a margin of error of +/- 3.4%.
Responses to our surveys are confidential. We do not look at individual responses but rather report data in the aggregate.
For more information about Virginia’s housing market, check out our most recent home sales report, local housing market data, or Facebook Live.
December 19, 2024 - Virginia REALTORS®
December 17, 2024 - Abel Opoku-Adjei
December 9, 2024 - Sejal Naik