Whose House? A Look at Household Types in Virginia
February 2, 2026 - Dominique Fair
Welcome Virginia REALTORS®
By Abel Opoku-Adjei
Research Associate, Virginia REALTORS®
Each month, the Virginia REALTORS® Confidence Survey gathers important information from REALTORS® on local housing markets based on their experiences with real estate transactions in the prior month. This data provides a real-time look at housing market conditions. This month’s Confidence Survey was conducted between November 28th and December 3rd, 2025, and reflects housing market conditions in Virginia in November 2025. A total of 649 Virginia REALTORS® members responded to the survey, including 476 who participated in a home sales transaction in the past month.
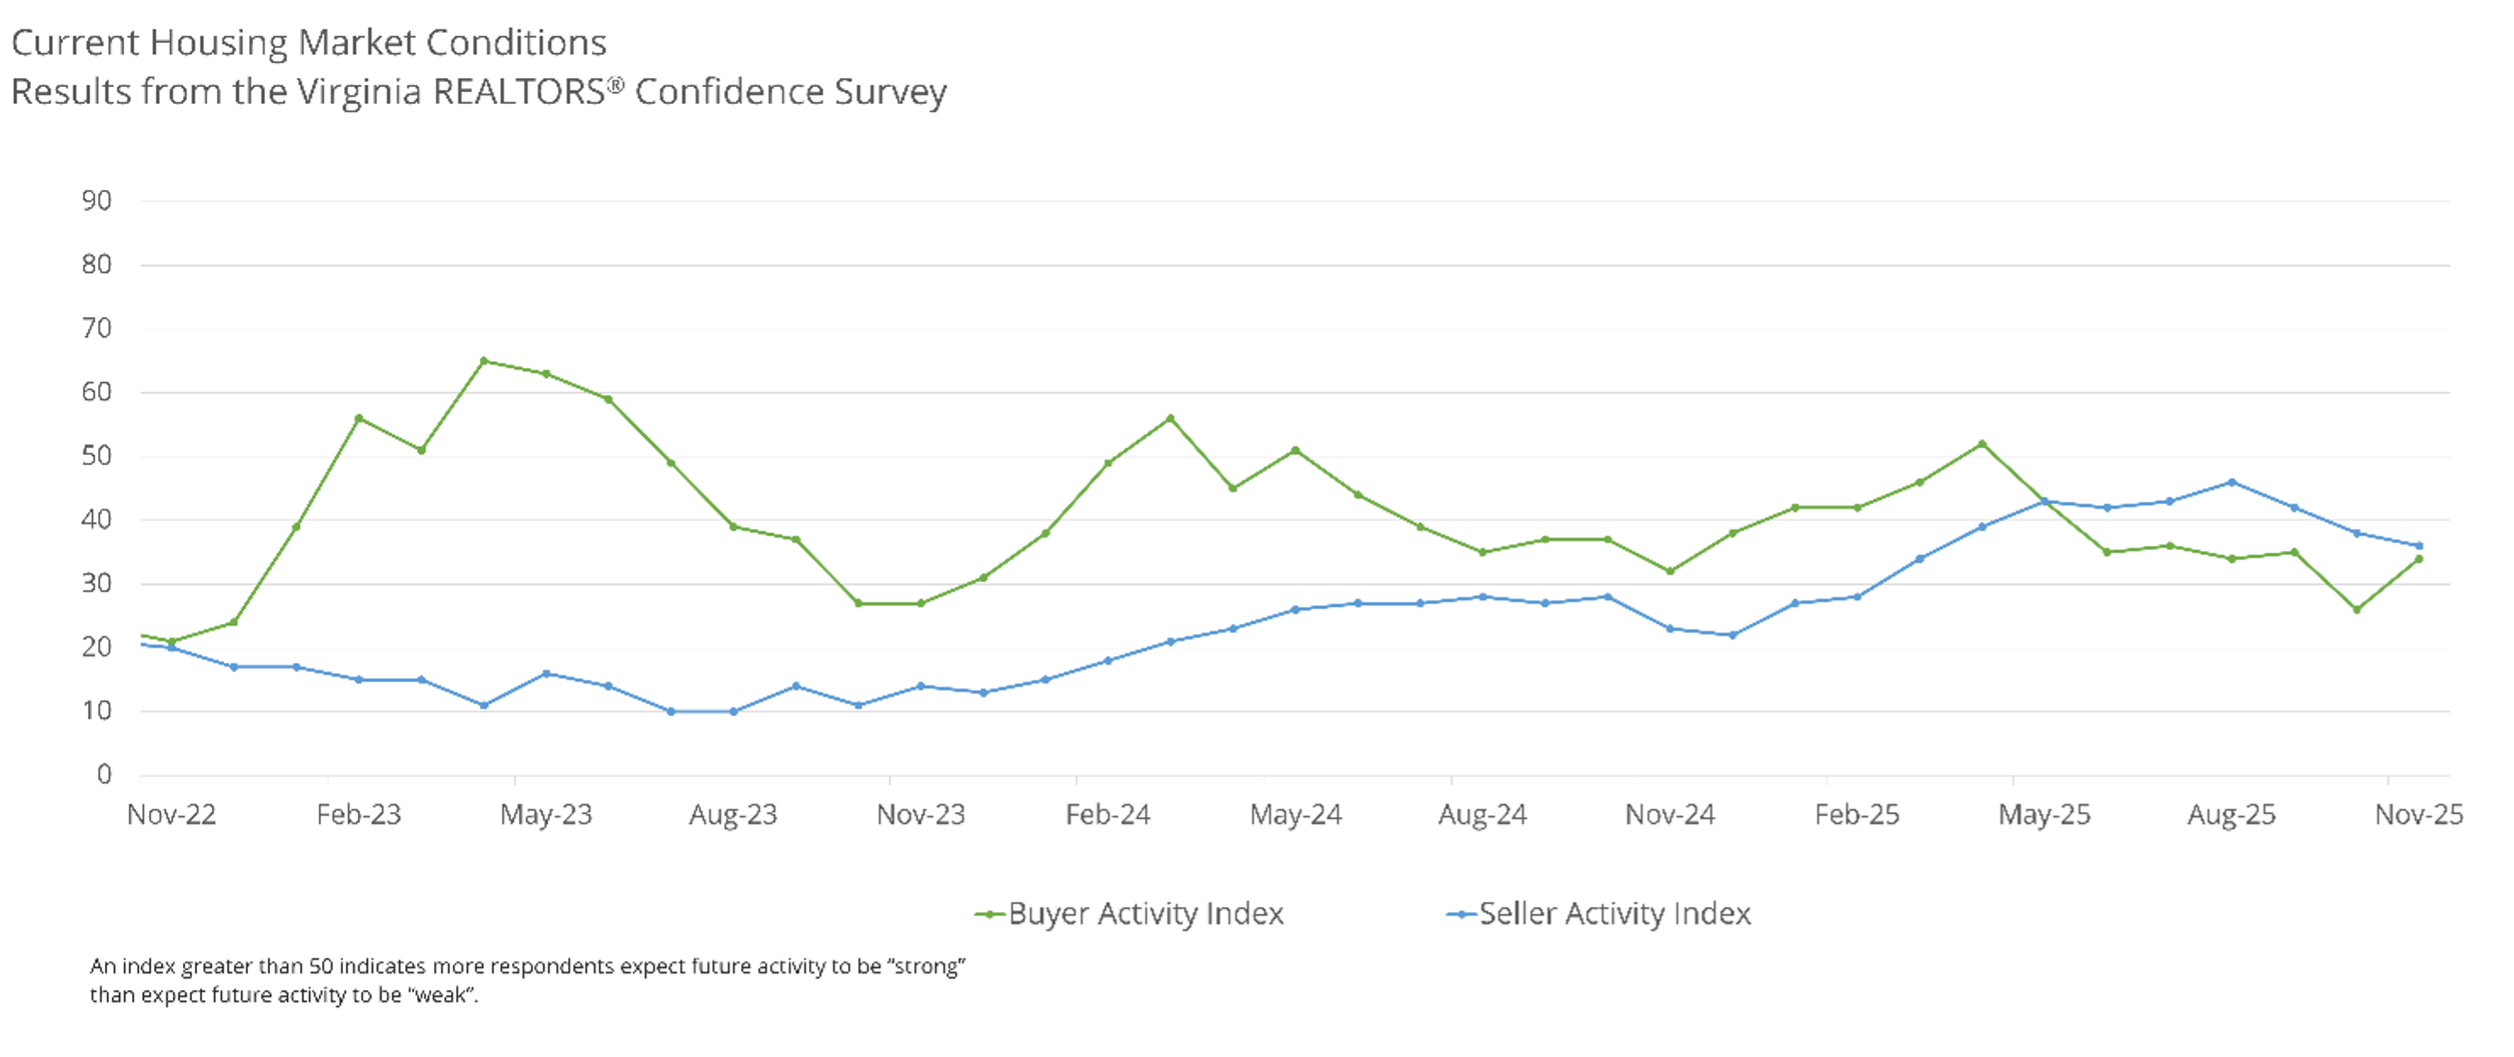
Current Market Conditions
Buyers
REALTORS® experienced an increase in buyer activity compared to the month before. The Buyer Activity Index in November rose to 34 from 26 in October. About 9% of respondents rated buyer activity in their local markets as “high” or “very high,” while 41% viewed it as “low” or “very low.”
Results From Virginia REALTORS® Confidence Survey
The November survey revealed that 27% of respondents experienced their latest transaction involving a first-time home buyer, a slight increase from 26% in the previous month. Around 24% of REALTORS® engaged in all-cash deals in November, a minor decrease compared to last month. Approximately 23% of REALTORS® managed transactions for non-primary residences, including rentals, second homes, or vacation properties, which is a 3% rise from October.
In November, the average number of offers before closing was 2.2, according to REALTORS®, up from 1.9 offers in the previous month. Additionally, about 20% of REALTORS® reported their clients received offers above the listing price this month, matching the percentage from October.
Sellers
Seller activity declined for the third consecutive month in November. The Seller Activity Index was 36, decreasing from 38 last month. Approximately 9% of REALTORS® said that seller activity in their area was “high to very high,” while 32% described it as “low to very low.”
Obstacles
Buyers
Buyer activity has slowed due to ongoing economic challenges that discourage home buying and cause delays in closing. Many clients face obstacles that hinder their closing process, with some issues more prominent. According to the survey, nearly 26% of REALTORS® cited limited housing options in Virginia as a major obstacle. Around 13% identified high mortgage rates as the key challenge, while approximately 9% noted that their clients struggle to save enough for a down payment.

Results From Virginia REALTORS® Confidence Survey
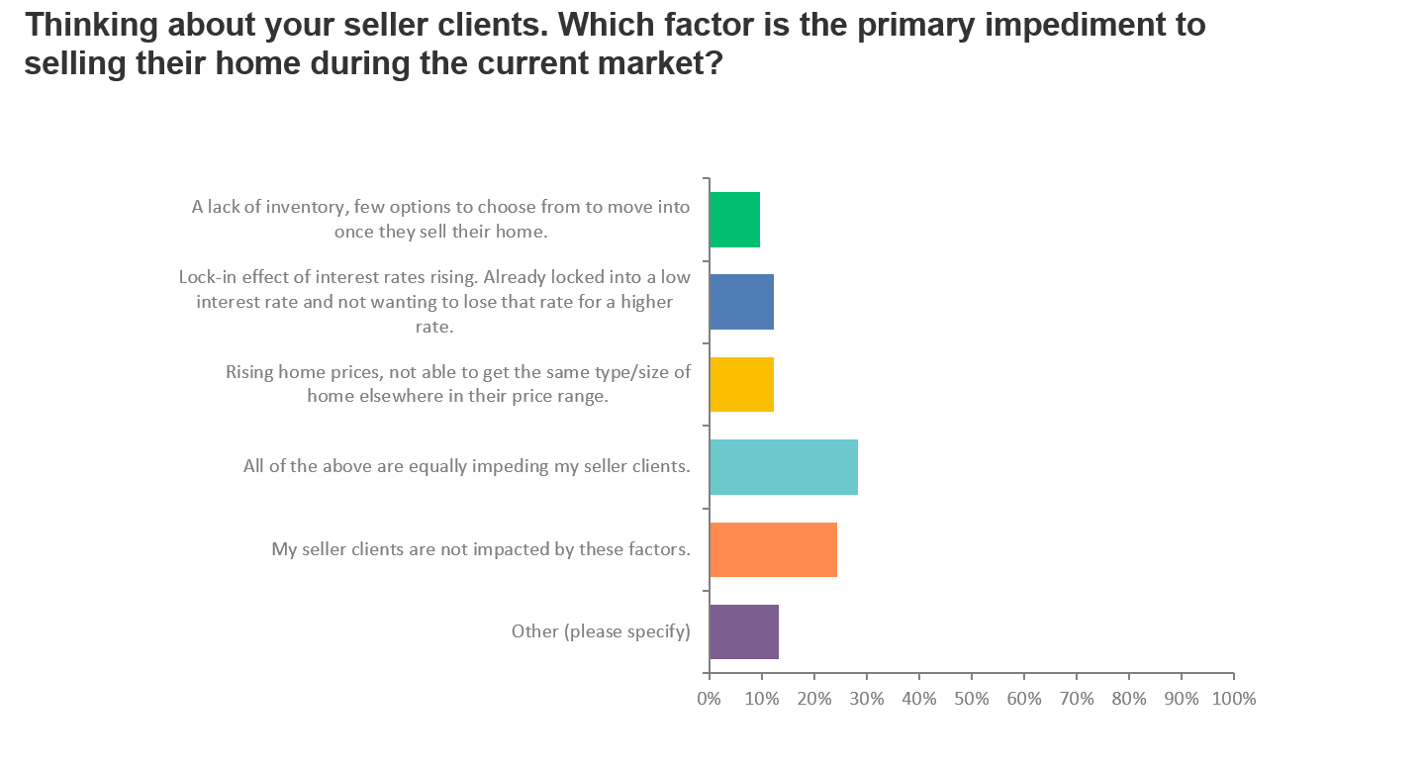
Sellers
Most respondents to the survey reported that a mix of these obstacles were affecting their clients. Roughly 14% of REALTORS® in Virginia said their seller clients were reluctant to sell because of the low interest rates on their existing homes. About 10% mentioned their clients struggled to find suitable properties due to limited market inventory. Around 12% identified rising home prices as the primary barrier to selling.
Results From Virginia REALTORS® Confidence Survey
Pending Sales Activity
The state recorded 8,450 pending sales in October, an increase of 396 from the previous year, up 4.9%. While most pending sales close successfully, various factors can cause delays or failures. The survey showed that 396 Virginia real estate agents reported at least one seller client with a purchase agreement; of these, 83 deals did not close as expected.
The November survey identified some common reasons for these failures. About 39% of sales fall through due to inspection issues. Approximately 11% were caused by low appraisals, and nearly 29% failed because buyers couldn’t secure mortgage approval in time. An additional 8% experienced job losses or financial hardships affecting their ability to get approved. Around 14% cited that their clients’ previous homes took too long to sell, and 6% pointed to major title issues as barriers to closing.
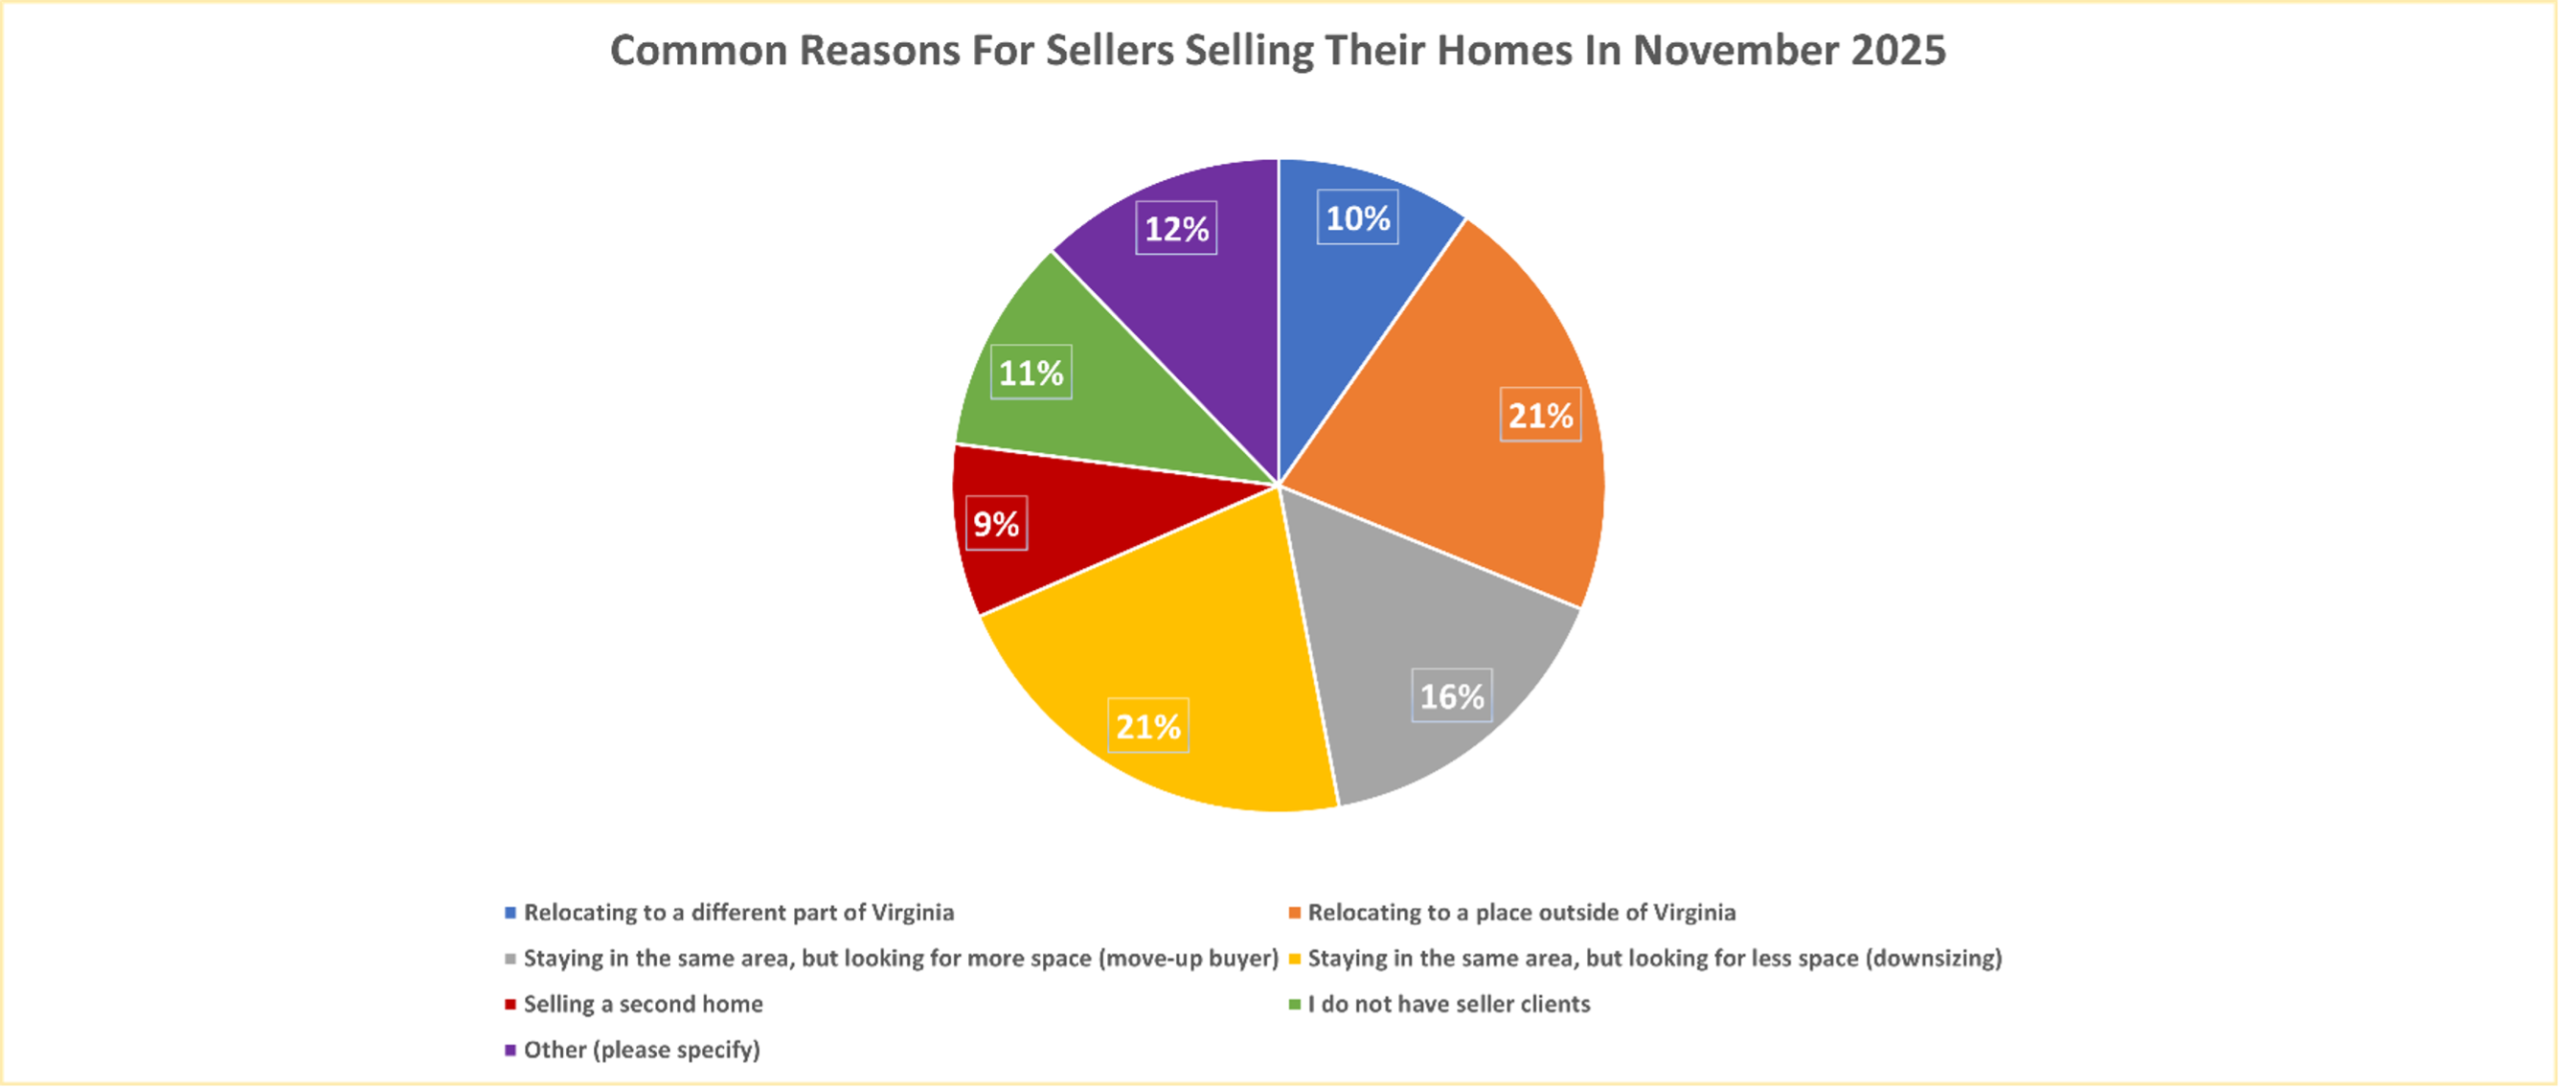
Reasons For Selling
Results From Virginia REALTORS® Confidence Survey
We analyzed the main reasons behind home listings in Virginia. According to the response, around 22% of REALTORS® reported that their seller clients were moving out of the state. Nearly 10% indicated that clients intend to relocate within Virginia. An additional 21% said clients want to downsize locally, while 16% noted clients seeking larger homes nearby. Finally, around 9% of agents observed their clients selling a second property this month.
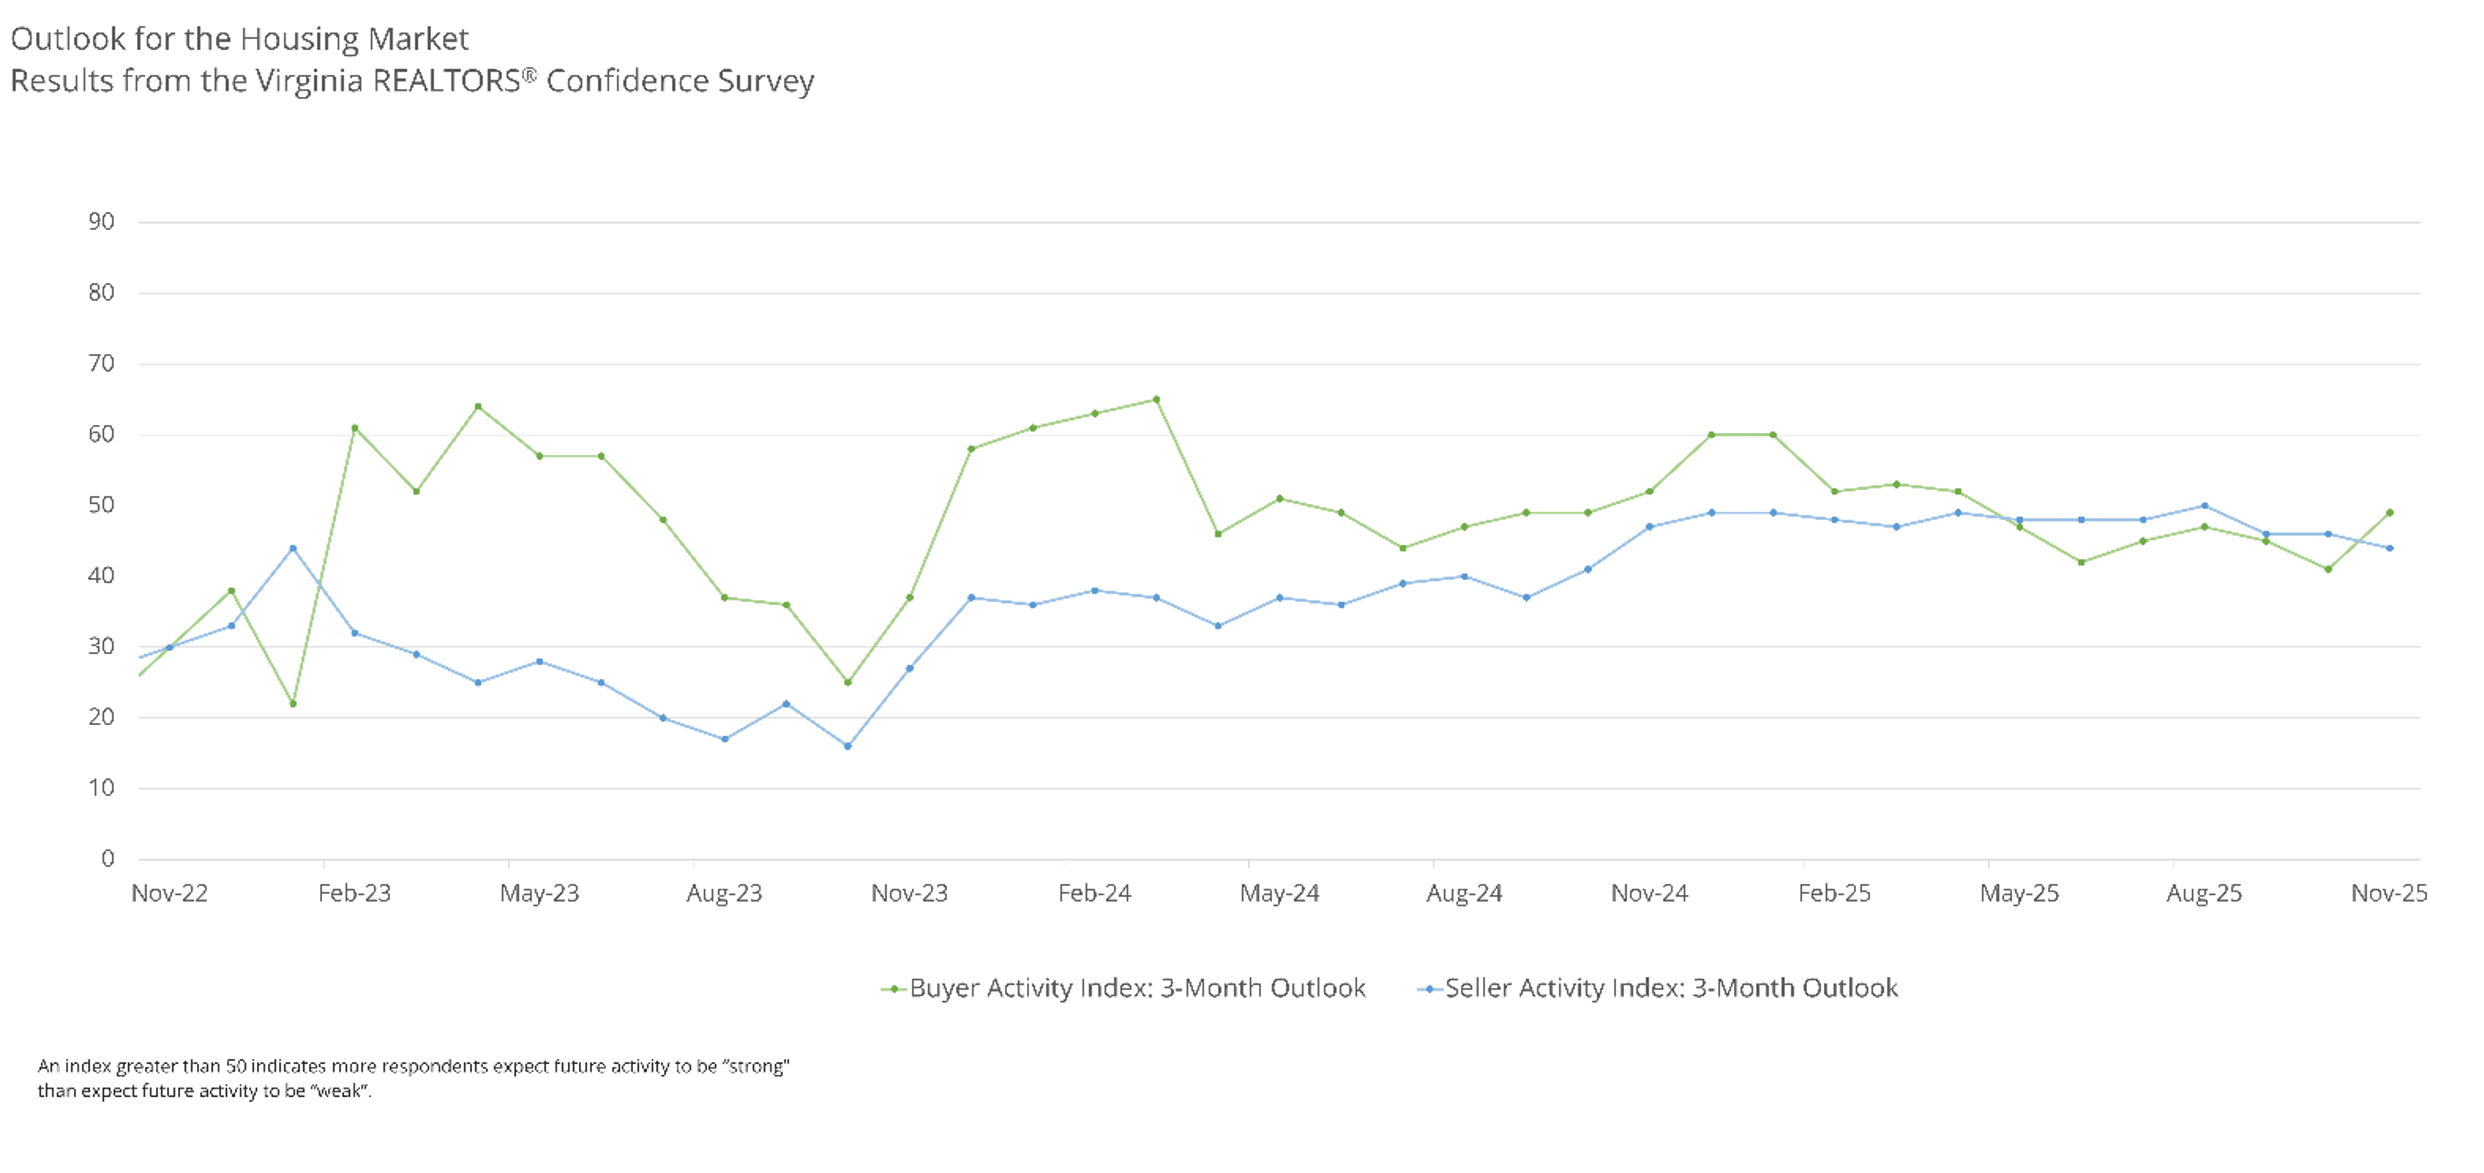
Market Outlook
Results From Virginia REALTORS® Confidence Survey
The outlook for future buyer activity has improved since last month. This index gauges REALTORS®’ expectations for market performance over the upcoming three months. In November, the three-month buyer activity index increased to 49, up from 41 in October. Around 19% of respondents expect an increase in buyer activity in their local markets in the next three months, whereas 21% predict a decline.
In November, the Seller Activity Index (3-Month Outlook) decreased to 44, a drop of two points from the previous month. Approximately 18% of Virginia REALTORS® forecast an increase in seller activity over the next three months, while 30% anticipate a decline from December to February. Additionally, 31% of surveyed REALTORS® in Virginia expect home prices to rise in the upcoming three months. About 31% believe prices will remain stable, and 32% predict a decrease.
Virginia REALTORS® Confidence Survey: 2025 Highlights
| Key Indicators | Jan
2025 |
Feb
2025 |
Mar
2025 |
Apr
2025 |
May
2025 |
June
2025 |
July
2025 |
Aug
2025 |
Sep
2025 |
Oct
2025 |
Nov
2025 |
| Buyer Activity Indexa | 42 | 42 | 46 | 52 | 43 | 35 | 36 | 34 | 35 | 26 | 34 |
| Seller Activity Indexa | 27 | 28 | 34 | 39 | 43 | 42 | 43 | 46 | 42 | 38 | 36 |
| Buyer Activity Index: 3-Month Outlookb | 60 | 52 | 53 | 52 | 47 | 42 | 45 | 47 | 45 | 41 | 49 |
| Seller Activity Index: 3-Month Outlookb | 49 | 48 | 47 | 49 | 48 | 48 | 48 | 50 | 46 | 46 | 44 |
| Current Market Conditions |
|
||||||||||
| First-time Homebuyers, as a Percent of All Sales | 26 | 32 | 26 | 26 | 36 | 32 | 31 | 31 | 32 | 26 | 27 |
| Cash Sales, as a Percent of All Sales | 25 | 19 | 27 | 24 | 21 | 21 | 21 | 20 | 20 | 25 | 24 |
| Sales as Non-Primary Residence, as a Percent of All Sales | 20 | 18 | 21 | 16 | 17 | 20 | 19 | 19 | 18 | 20 | 23 |
| Average Number of Offers, Most Recent Transaction | 2 | 1.9 | 2.3 | 2.3 | 2.1 | 1.8 | 1.8 | 1.3 | 1.2 | 1.9 | 2.2 |
| Market Outlook | |||||||||||
| Percent of Respondents Who Expect Strong Buyer Activity in 3 Months | 36 | 27 | 27 | 25 | 18 | 14 | 15 | 18 | 18 | 13 | 9 |
| Percent of Respondents Who Expect Strong Seller Activity in 3 Months | 14 | 20 | 18 | 20 | 15 | 17 | 16 | 19 | 17 | 15 | 7 |
| Percent of Respondents Who Expect Prices to Rise in 3 Months | 50 | 49 | 40 | 47 | 31 | 25 | 22 | 22 | 23 | 23 | 31 |
| Percent of Respondents Who Expect Prices to Fall in 3 Months | 16 | 19 | 23 | 24 | 32 | 41 | 41 | 41 | 40 | 43 | 32 |
| Percent of Respondents Who Expect Prices to Remain Unchanged in 3 Months | 30 | 26 | 33 | 26 | 30 | 30 | 31 | 32 | 32 | 25 | 31 |
A An index greater than 50 indicates more respondents reported the level of activity as “high to very high” than reported the level of activity as “low to very low.”
B An index greater than 50 indicates more respondents expect future activity to be “strong” than expected future activity to be “weak.”
A note about surveys: This is not a randomized sample survey of Virginia REALTORS® members. However, the number of responses and the geographic coverage of respondents make it possible to draw conclusions about the opinions and expectations of Virginia REALTORS®. These statistics from this survey have a margin of error of +/- 3.48%.
Responses to our surveys are confidential. We do not look at individual responses but rather report data in the aggregate.
For more information about Virginia’s housing market, check out our most recent home sales report, local housing market data.
February 2, 2026 - Dominique Fair
January 26, 2026 - Virginia REALTORS®
January 21, 2026 - Sejal Naik