New Multifamily Construction Cools As Vacancy Rates Increase
March 17, 2026
By: Abel Opoku-Adjei
Assessing the vacancy rate helps evaluate the balance between supply and demand in the market. Low vacancy rates typically indicate a limited housing supply and strong competition for homes or rental units. Conversely, higher vacancies suggest more new construction entering the market. The Census Bureau reports that the national rental vacancy rate in the fourth quarter of 2025 was 7.2%, up slightly from 6.9% in the same period of 2024. Analyzing fourth-quarter trends from 2020 to 2025 offers insights into how increasing supply has affected vacancy rates, available rental units, and housing conditions across Virginia’s metropolitan areas.
Vacancy Conditions
During the early pandemic years, in Virginia, rental vacancy rates declined from 5.9% in Q4 2020 with 36,859 vacant units, to 4.7% in Q4 2021, marking the lowest level in this five-year period due to high demand and fewer units available. However, the vacancy rate began to climb after 2021 as newly constructed apartments entered the market. By the fourth quarter of 2025, the vacancy rate reached 6.8%, with 48,042 vacant rental units statewide.
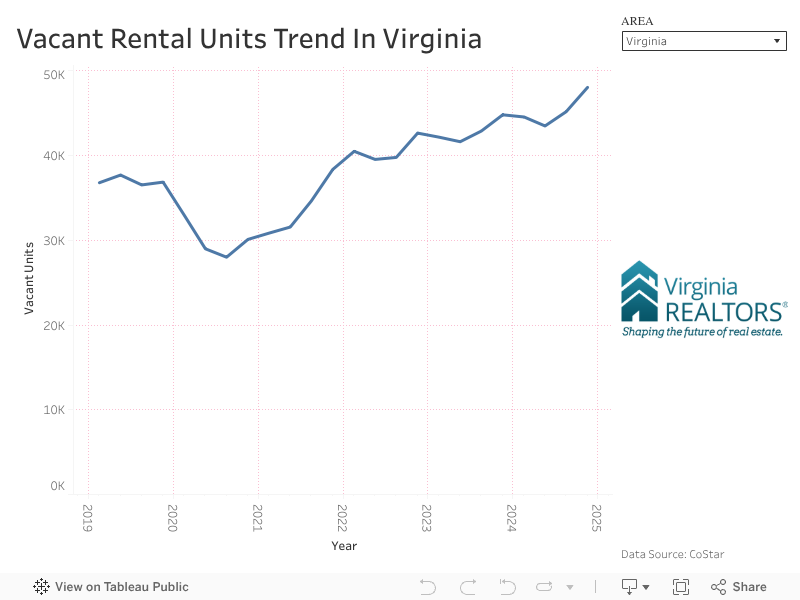
Source: CoStar, Virginia REALTORS® – Having trouble viewing? Click here.
Although statewide trends give a general view of the rental market, vacancy rates vary across Virginia’s metropolitan regions. In Q4 2025, some markets recorded rates higher than the state average. Richmond, one of Virginia’s larger metro areas, experienced an 8.5% vacancy rate during this period. Smaller metro areas like Charlottesville (10.6%), Lynchburg (10.5%), Harrisonburg (8.3%), and Winchester (9.3%) also had higher vacancy rates than the state average.

Source: CoStar, Virginia REALTORS® – Having trouble viewing? Click here.
Construction Surged and Then Slowed Down
Developers responded to the tight inventory in Virginia as construction surged between 2021 and 2023, peaking at 31,175 units under construction in Q4 2022. However, the development pipeline has begun to cool more recently. By Q4 2025, the number of multifamily units under construction had declined to 19,320. This is 38.0% lower than the peak in Q4 2022. Deliveries of completed multifamily units also slowed, with 3,689 units delivered in the fourth quarter of 2025, down 21.6% compared to the prior year. This slowdown could be due to higher borrowing costs and construction costs.
Northern Virginia leads the state in rental construction. As Virginia’s largest metro area, it continues to draw renters due to its robust job market. Richmond has the second-largest share of new multifamily units, with its growing population and expanding employment opportunities appealing to developers. While the metro region’s high vacancy rate indicates that new apartment supply has temporarily exceeded demand, this is typical in regions with high development activity.

Source: CoStar, Virginia REALTORS® – Having trouble viewing? Click here.
Overall, the distribution of multifamily construction across Virginia reflects broader economic patterns. Larger metro areas attract developers due to stronger job growth and population gains, while smaller markets experience limited rise in rental inventory. As construction activity moderates and the market absorbs recently delivered units, vacancy rates may stabilize in the long term.
For more information on housing, demographic and economic trends in Virginia, be sure to check out Virginia REALTORS® other Economic Insights blogs and our Data page.
You might also like…
Key Takeaways: May 2026 Virginia Home Sales Report
By Virginia REALTORS® - June 23, 2026
Key Takeaways Home sales activity increased in May, supporting the continued trend of rising home sales since the beginning of 2026. There were 10,940 closed sales across the… Read More
Celebrating National Homeownership Month: What Virginia’s Housing Data Tells Us
By Sejal Naik - June 17, 2026
June is National Homeownership Month—a timely reminder of the vital role that owning a home plays in building wealth, stabilizing communities, and strengthening the broader economy. For real… Read More
A Check-In on Rent Trends in Virginia
By Dominique Fair - June 16, 2026
After rising by double digits a few years ago, rent growth has slowed recently as supply and demand continue to stabilize. This shift has not only impacted renters… Read More