3 key takeaways from Virginia’s New Population Estimates
May 27, 2026
Each year, the Demographic Research Group at University of Virginia’s Weldon Cooper Center develops and releases the official population estimates for Virginia and its counties and independent cities based on American Community Survey estimates. This data can be used to understand the changing demographics of the population and how to best serve their needs. Below are some of the highlights from the recent population estimates as of July 1, 2025, spanning the change from April 2020 through July 2025.
1. From 2020 through 2025, Virginia’s population grew slower compared to the period from 2010 through 2015.
Between 2010 and 2015, Virginia’s population grew by almost 394,000, while in the five years since the 2020 census, Virginia’s population grew by over 248,000. We still have more people living here, but the gain has gotten smaller over time. Reaching 8.88 million, Virginia’s population grew at an annual rate of 0.5%, which is slightly lower than the national growth rate. Virginia remains the 12th most populous state in the United States. 93 out of 133 counties and cities in Virginia experienced population growth.
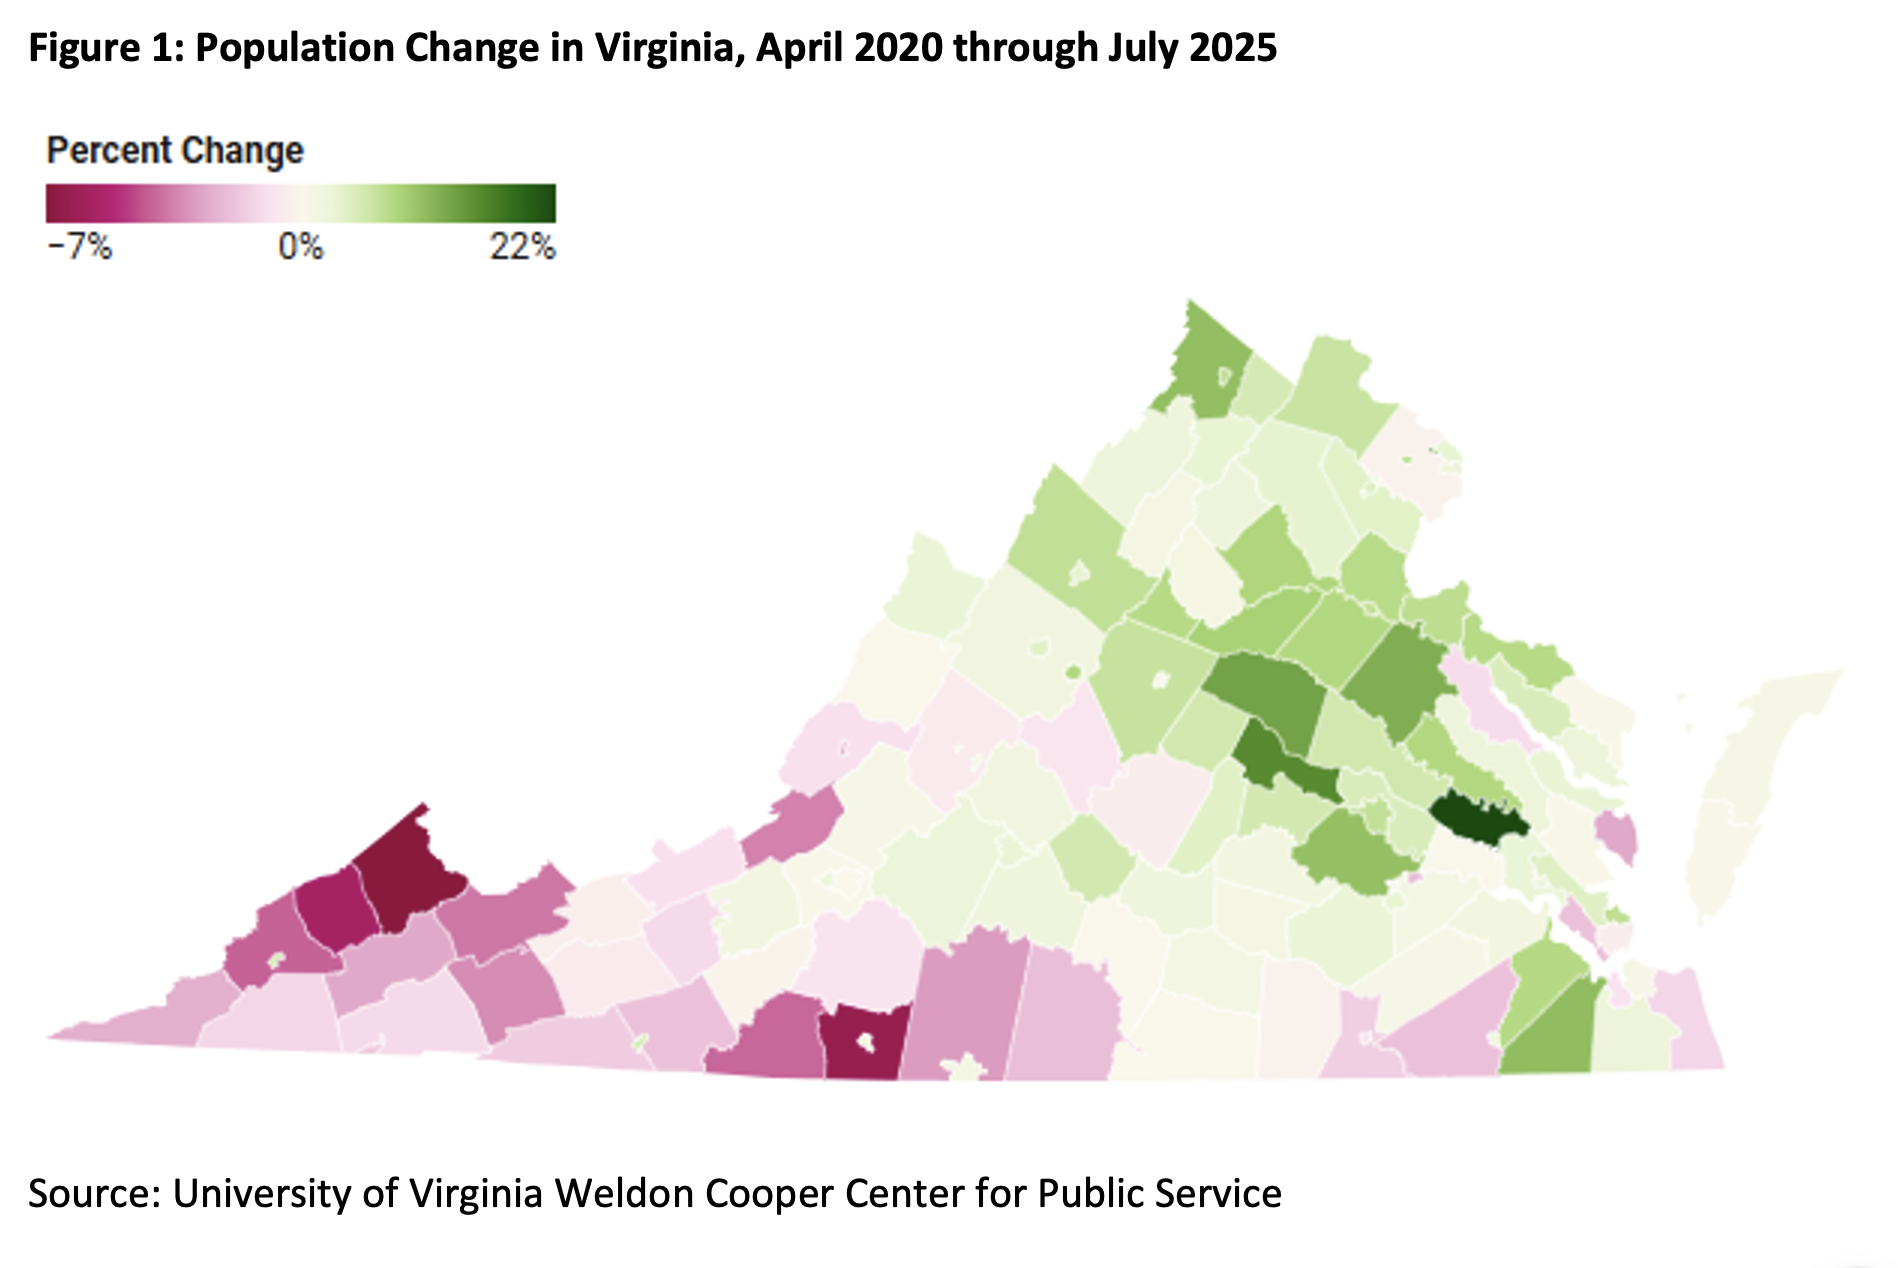
2. Net migration contributed most to the population growth across the Commonwealth since 2020.
Net migration (people moving in minus people moving out) contributed to 68.5% of population growth across Virginia over the last five years. At the same time, natural increase (births minus deaths) made up 31.5% of the population growth. 119 out of 133 localities across the Commonwealth experienced positive net migration since 2020. On the other hand, 93 out of 133 localities experienced a natural decrease, wherein deaths outnumbered births. Virginia’s attractiveness in terms of jobs and higher education opportunities has supported population growth despite the aging population in many areas of the Commonwealth.
3. Most of Virginia’s population growth occurred in the metro areas.
In 2025, about 88% of Virginians lived in metropolitan areas. 97.6% of the state’s population growth occurred in the metro areas. Positive net migration majorly contributed to this population growth. At the same time, micropolitan areas, which contained nearly 3% of Virginia’s population in 2025, saw a decline in population, driven primarily by natural decrease, as deaths exceeded births. Rural areas accounted for approximately 9% of Virginia’s population and contributed to 1.6% population growth across the Commonwealth. While these areas saw more deaths than births, they also gained more residents through net migration.
For more information on housing, demographic and economic trends in Virginia, be sure to check out Virginia REALTORS® other Economic Insights blogs and our Data page.
You might also like…
Key Takeaways: NLIHC 2025 National Renter Survey
By Dominique Fair - September 23, 2026
The National Low Income Housing Coalition (NLIHC) released their first National Renter Survey highlighting renters’ decisions and experiences related to moving, housing costs and accessibility and habitability. Let’s… Read More
Key Takeaways: August 2026 Virginia Home Sales Report
By Virginia REALTORS® - September 23, 2026
Key Takeaways Sales activity in many parts of the Commonwealth slowed down in August as mortgage rates continued to rise. There were 8,985 closed sales statewide, 438 fewer… Read More
A Snapshot of the Cost of Living in Virginia
By Abel Opoku-Adjei - September 10, 2026
The cost of living significantly influences where people decide to live, work, and buy homes. Virginia offers a diverse range of communities, from the more expensive suburbs of… Read More