Three Multifamily Market Trends from the Third Quarter of 2025
October 20, 2025

Each quarter, through its Multifamily Market report, the research team at Virginia REALTORS® analyzes the trends and changes in the multifamily market. Here, we share the key insights from the most recent report for the third quarter of 2025.
Delivery of new multifamily units continued to experience a slowdown in the third quarter of 2025, and the construction pipeline continues to get smaller.
There were 21,418 multifamily units under construction in Q3 2025, 12% lower compared to the same time last year. Among the metro areas, Northern Virginia and Richmond had the largest share of new multifamily construction in the commonwealth. At the same time, deliveries slowed, with 3,908 multifamily units delivered in Q3 2025, which was 38% lower than the number of units delivered during the same time last year.

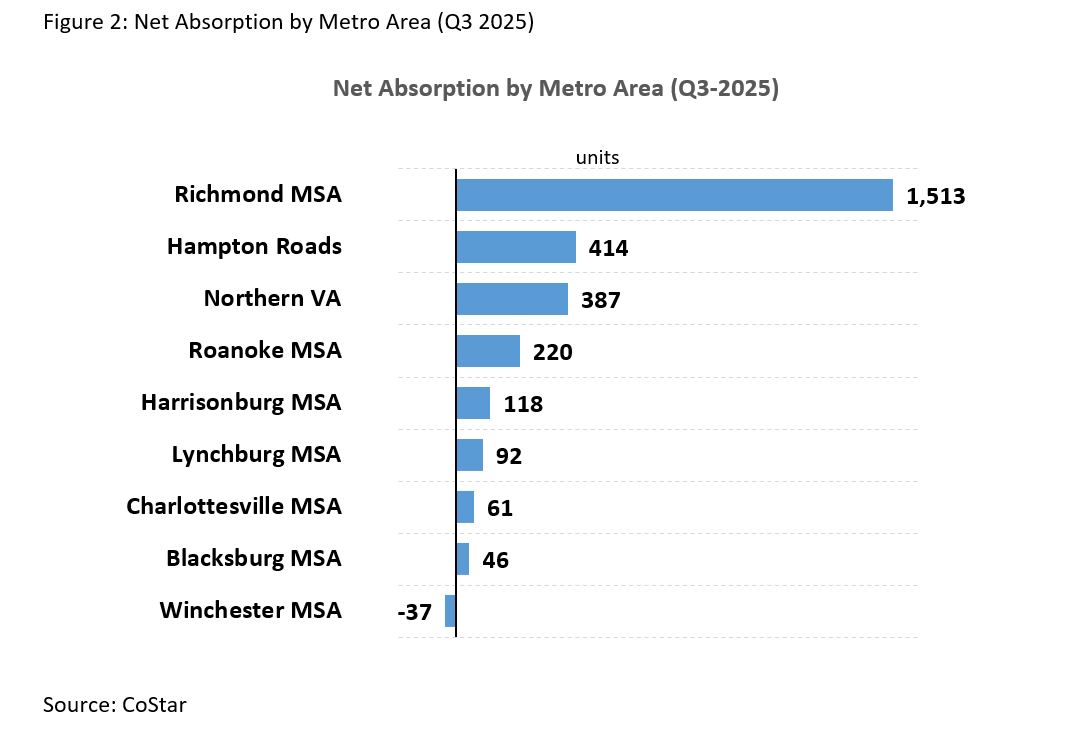
For the second quarter in a row, net absorption slowed.
Net absorption–the difference between number of units leased and number of units vacated–was positive in Q3 2025, meaning more space was leased than vacated in the market. However, net absorption slowed down from the prior year for the second quarter in a row. This indicates that while there is demand in the rental market, it is slowing down from previous periods. 2,791 units were absorbed in multifamily housing in the third quarter in Virginia. Richmond (1,513 units) led the list of Virginia metro areas for the highest number of leased spaces this quarter, while the Winchester multifamily market experienced negative absorption in the third quarter of 2025 with 37 units of vacated space.
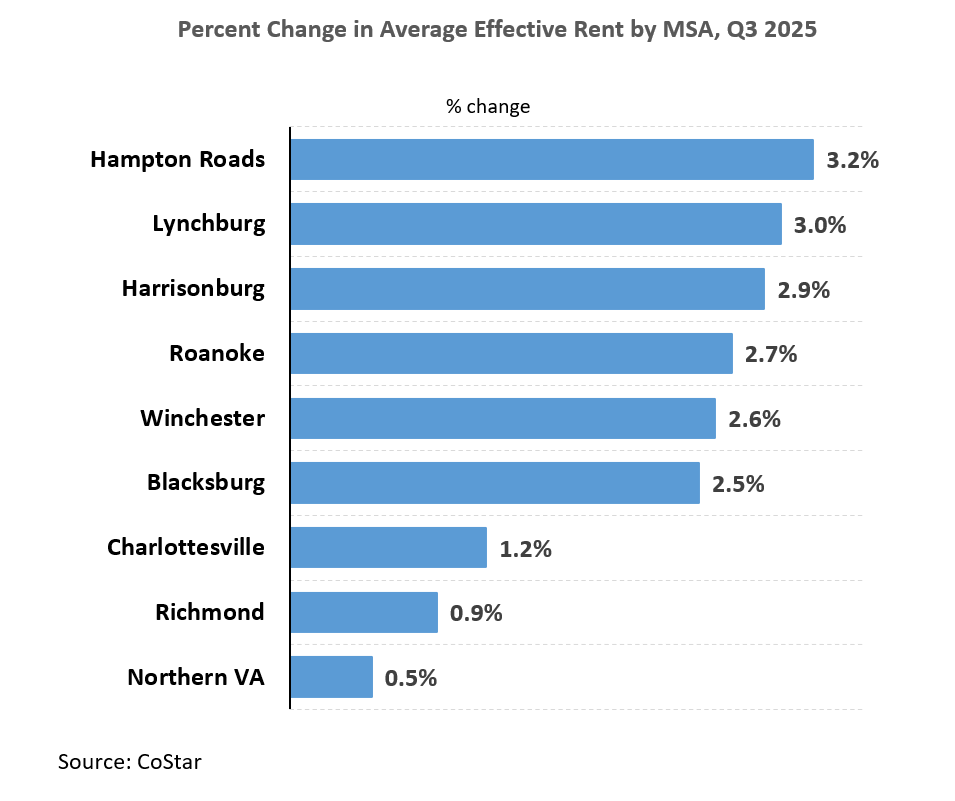
Rental prices continued their upward trajectory.
The average effective rent per unit in Virginia was $1,802 in Q3 2025, increasing 1.3% from the same time last year, signifying that rental prices continue to climb. Rental prices went up in all nine metro areas of the commonwealth. Hampton Roads topped this list by experiencing a 3.2% increase in rent while Northern Virginia had the slowest rent increase of 0.5%.
For more information on housing, demographic and economic trends in Virginia, be sure to check out Virginia REALTORS® other Economic Insights blogs and our Data page.
You might also like…
Key Takeaways: February 2026 Virginia Home Sales Report
By Virginia REALTORS® - March 19, 2026
Key Takeaways Home sales activity picked up in February, furthering the upward trend at the start of 2026, fueled by a combination of higher inventory and lower mortgage… Read More
Home Price vs. Household Income in Virginia
By Sejal Naik - March 2, 2026
Affordability constraints are talked about often when discussing the housing market situation in Virginia. Potential first-time home buyers, especially, have been in a tough spot as they look… Read More
Key Takeaways: January 2026 Virginia Home Sales Report
By Virginia REALTORS® - February 23, 2026
Key Takeaways There was a modest uptick in sales activity statewide to start the year. There were 5,881 home sales in Virginia in January 2026, outpacing last January… Read More