Three Multifamily Market Trends from the Fourth Quarter of 2025
January 21, 2026

Each quarter, through its Multifamily Market report, the research team at Virginia REALTORS® analyzes the trends and changes in the multifamily market. Here, we share the key insights from the most recent report for the last quarter of 2025.
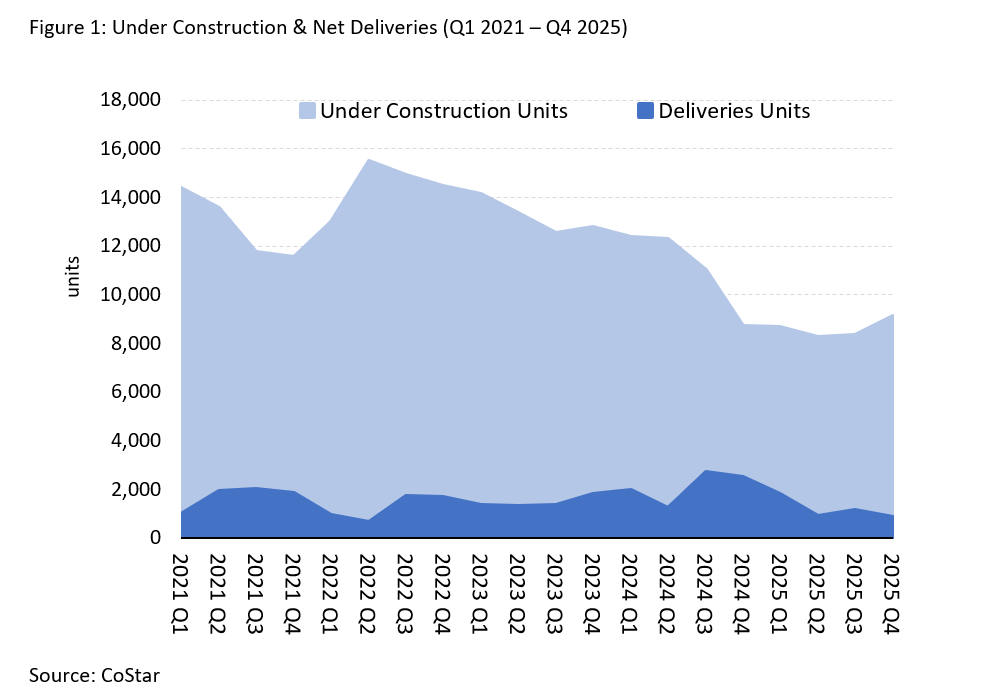
Delivery of new multifamily units continued to experience a slowdown in the fourth quarter of 2025 along with a declining construction pipeline.
There were 19,320 multifamily units under construction in Q4 2025, 8% lower compared to the same time last year. Among the metro areas, Northern Virginia and Richmond had the largest share of new multifamily construction in the Commonwealth. Deliveries of completed multifamily units slowed as well, with 3,689 multifamily units delivered in Q4 2025, which was 22% fewer units delivered compared to the same time last year.
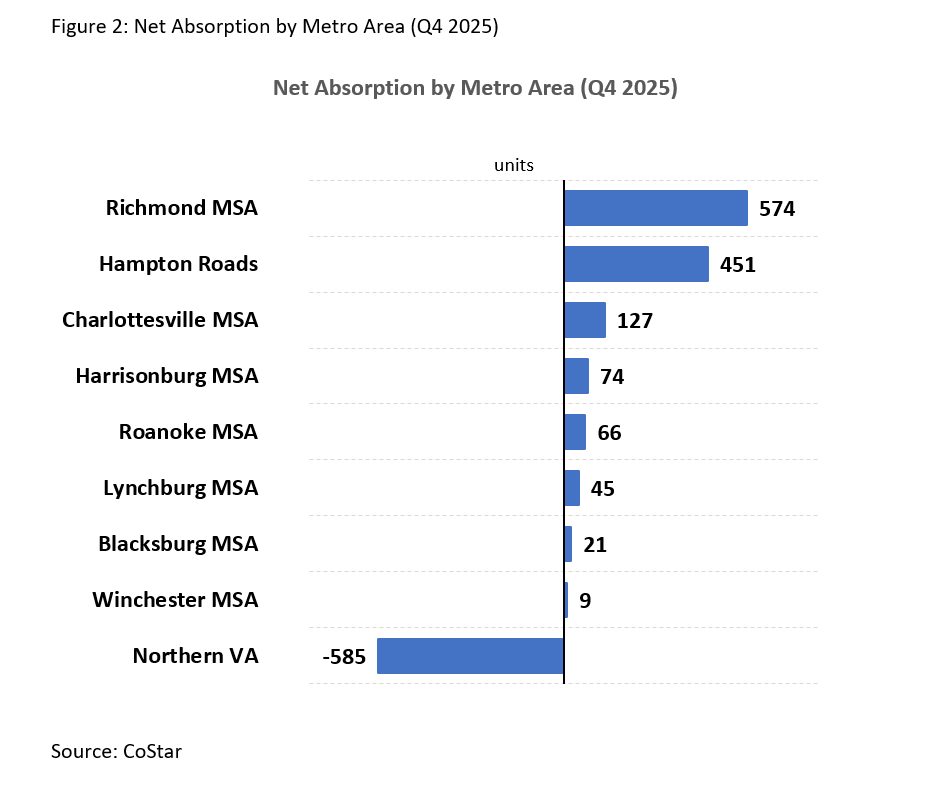
Net absorption slowed for the third consecutive quarter.
Net absorption–the difference between number of units leased and number of units vacated–was positive in Q4 2025 (822 units), meaning more space was leased than vacated in the market. However, net absorption slowed down from the prior year for the third quarter in a row. This indicates that while there is demand in the rental market, it is slowing down from previous periods. While Mid/High rise apartments saw positive net absorption, Garden style/low rise apartments saw more units being vacated than leased out in the last quarter of 2025. Richmond (574 units) led the list of Virginia metro areas for the highest number of leased spaces this quarter, while the Northern Virginia multifamily market experienced negative absorption in the fourth quarter of 2025 with 585 units of vacated space.
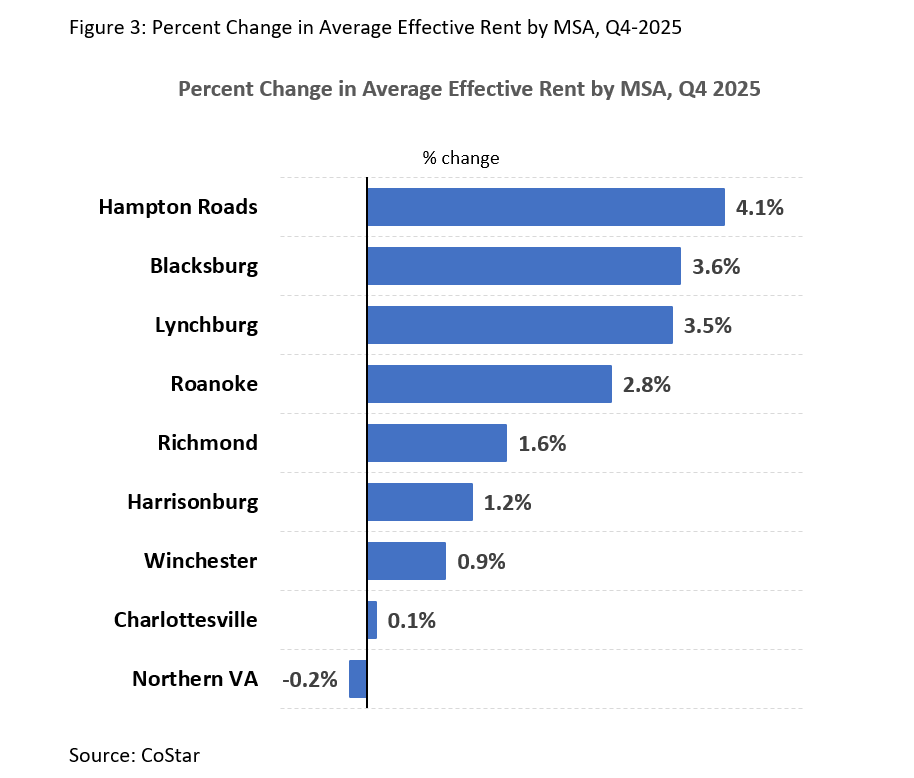
Rental prices continued their upward trajectory, with variability across different local markets.
The average effective rent per unit in Virginia was $1,794 in Q4 2025, increasing 1.1% from the same time last year, signifying that rental prices continue to climb. Rental prices went up in eight of the nine metro areas of the Commonwealth. Hampton Roads topped this list by experiencing a 4.1% increase in rent while Northern Virginia saw a rent decline (-0.2%).
For more information on housing, demographic and economic trends in Virginia, be sure to check out Virginia REALTORS® other Economic Insights blogs and our Data page. You can also find our latest infographic with these trends in a handy, at-a-glance guide on our infographics page.
You might also like…
Key Takeaways: January 2026 Virginia Home Sales Report
By Virginia REALTORS® - February 23, 2026
Key Takeaways There was a modest uptick in sales activity statewide to start the year. There were 5,881 home sales in Virginia in January 2026, outpacing last January… Read More
Building Permit Trends and Impacts on Housing
By Abel Opoku-Adjei - February 20, 2026
Before housing construction begins, a project must go through a complex permitting process in the local area. While permits may seem like a routine step, builders nationwide have raised concerns about how complex and time-consuming this process is. Delay… Read More
Migration to Virginia: More People Moving In
By Sejal Naik - February 18, 2026
Each year since 2005, the U.S. Census Bureau determines whether respondents of its surveys lived in the same residence a year ago. If people have moved, then the… Read More